|


YGOR Fundamentals
Menu Bar
State/Status Frame
Lock/Unlock Frame
Parameters
Samplers
Error Traps
|
|
On a typical CLEO screen that connects 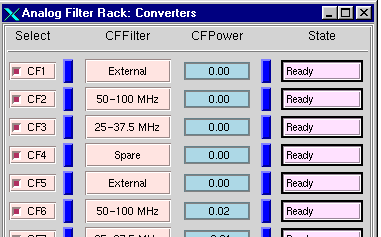 to
an YGOR manager
for a device, you will usually find numerous widgets that report the value of samplers.
For example, here is part of one of the screens associated with the Analog
Filter Rack. CFPower is a column of samplers and all other columns
are parameters. to
an YGOR manager
for a device, you will usually find numerous widgets that report the value of samplers.
For example, here is part of one of the screens associated with the Analog
Filter Rack. CFPower is a column of samplers and all other columns
are parameters.
The sampler widgets are color coded in the following ways:
Sampler Color Coding
| Color |
Description |
| Light blue background |
Sampler is OK. |
| Orange background |
YGOR has flagged the sampler as not being updated properly. |
|
Red border
|
sampler has a value that is out of range. |
Since samplers are one of the major ways for one to assess the health of a
device, we have associated a powerful tool, a sampler gadget, with every
sampler.
Sampler Gadget:
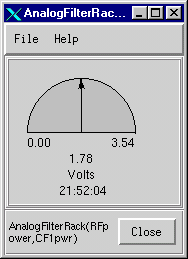 When
you right double click on a sampler on any CLEO screen (for example any of the
light blue CFPower widgets on the Analog Filter Rack), a popup will appear that
will allow you to graph the values of the sampler values as well as query all
the information CLEO knows about the sampler. To the left is what a
sampler gadget looks like. When
you right double click on a sampler on any CLEO screen (for example any of the
light blue CFPower widgets on the Analog Filter Rack), a popup will appear that
will allow you to graph the values of the sampler values as well as query all
the information CLEO knows about the sampler. To the left is what a
sampler gadget looks like.
Types of graphs
| Full Circle |
Line (strip chart) |
 |
 |
| Horizontal Bar |
Value |
 |
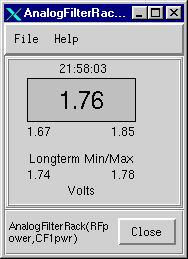 |
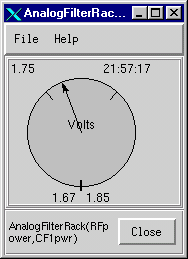
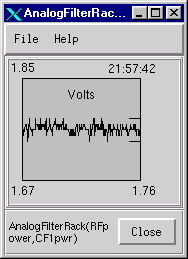
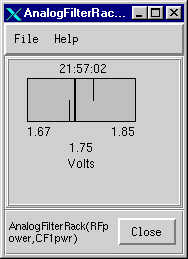
The gadget can produce five different types of graphs, the default being the
semi-circular graph you see above. The other possibilities are illustrated
below. In all cases, the graph is resizable. This should make it
convenient for you to see the graph from across the room if you need to work on
the device at the same time as monitoring the sampler values.
To change the type of graph, right-click on the gadget and a popup will
appear. Just pick the type of graph you want from the pull-right menu. 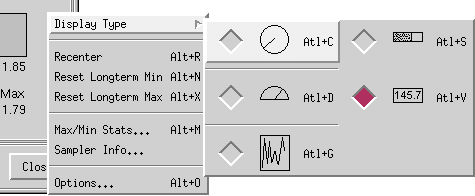
Features of the graph
Each of the graph type shows:
- the units of the sampler, if known (Volts in the above example).
- the range of the graph values (1.67 to 1.85).
- the time of the current sample (21:57 UT).
- the current value (1.75).
- a long-term minimum and maximum value indicated either by small tick marks
or, in the case of a value display, by a numerical representation.
In addition, the graph is color coded:
Graph Color Coding
| Color |
Description |
| Black Graph |
Graph is functioning normally. |
| Blue Graph |
Current value exceeds that allowed by the graph's range of values. |
|
Red Outline |
Current value exceeds a user-specified range of data values. |
|
Red Interior
|
Current value exceeds the Monitor and Control suggested range of
values. |
You can also print the graph to a PostScript printer or create a PostScript
file using the Print command found under the gadget's File menu.
Changing the graph options
The sampler gadget also allows you to change various display options. 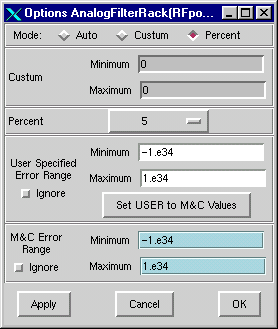 To change an option, right click on the gadget and select the Options... item
from the popup menu. An options menu should then appear. The menu
allows you to:
- Change the mode of how the limits of the graph are determined using the Mode
radio buttons at the top of the gadget. The choices are:
- Auto -- the gadget will look at up to the last few hundred
samples, determine the maximum and minimum values, and set the graph
limits to those values.
- Custom -- the user specifies the limits in the Minimum
and Maximum entry fields in the Custom frame.
- Percent -- the user specifies a percentage in the Percent
pull down menu. The gadget will make the graph limits plus and
minus the specified percentage from the current sampler value.
- Specify an error range which, if the sampler value exceeds, will make the
border of the graph turn red. The user can turn on or off this error
range (with the Ignore check button), specify a range by hand, or
initialize the range to that specified by the YGOR Monitor and
Control system.
- Ignore when the sampler value goes beyond that specified by the M&C
system. For some samplers, the M&C system provides a minimum and
maximum for a sampler value. These values, if they exist, are given in
the light blue widgets on the
Options menu. If the value of the sampler exceeds this range,
the graph interior will turn red. You can have the sampler ignore the
M&C value range by using the Ignore check button.
- Change the numerical format of the numbers displayed on the gadget (e.g.,
scientific notation vs. fixed point; number of significant digits, ...)
Other features of the Sampler Gadget
From the popup menu, you can:
- Recenter the graph if you are using the Auto or Percent
mode of display. This recalculates the display limits using the most
recent sampler values.
- Reset either the long term minimum or maximum values shown on the graphs.
- Produce a screen with statistical information about the sampler values.
- Produce a screen that tells you all the information CLEO knows about the
sampler.
Note that you can use shortcut keys to activate various menu options (e.g.,
holding down the Alt key and pressing O will bring up the Options menu).
|


 To change an option, right click on the gadget and select the Options... item
from the popup menu. An options menu should then appear. The menu
allows you to: