|
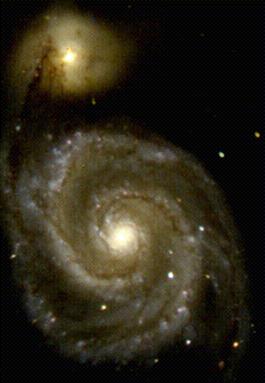
Lesson 1: The Discovery of the Milky Way
The Milky Way Galaxy is a vast collection of over 100 billion stars.
Our Sun is placed about two-thirds away from the center. It has taken
almost four hundred years to understand our location in the Universe.
In this lesson, you'll learn about advances in or understanding of the galaxy
through history.
There is no mathematics in this lesson, but plenty of links
to other sites, which give more detailed information.
The lesson ends with
questions to be answered based on your understanding of each
astronomer's contribution to our understanding of the Milky Way.
|
|
Lesson 2: Introduction to Image Processing
In the second lesson, you will analyze images taken by the Green
Bank Earth Station. You will learn to use the image processing
software program Sky Image Processor (SIP). The result of your
analysis will be radio brightness measurements taken on a group of
different radio sources. There is minimal mathematics
required to perform this exercise.
|
|
Lesson 3: Measuring Radio Flux
Scientists make measurements.
In this lesson, you will continue to analyze images taken by
the Green Bank Earth Station. You will continue to use the Sky Image Processor software. The result of your analysis will be intensity measurements taken on a group of different radio sources.
The set of images (left) shows the region of the galaxy containing the
binary X-ray star Cygnus X-3.
The radio radio flare of Cygnus X-3 is seen in the image labeled GP 8.4.
Cygnus X-3 is the radio source at the center if the image.
During the GPA survey (GPA 8.4) the X-ray star was quiet and is not seen.
detected.
The ROSAT X-ray satellite shows in this region, ONLY Cygnus X-3 is bright.
The optical image (CYGNUS X-3) no hint of the exciting events going on
inside the dark cloud.
|
|
Lesson 4: Measuring Distance
In the fourth lesson, you will continue to analyze images taken by
the Green Bank Earth Station. In lesson 4, the emphasis is on
using image analysis software to compute the angular distance to
an astronomical object and from that information, to calculate
the distance to the object. A new analysis tool will be introduced
in this lesson. You will link to the Aladin website. There is minimal mathematics required to perform this exercise.
|
|
Lesson 5: Measuring Temperature
In the fifth lesson, you will continue to analyze images taken by
the Green Bank Earth Station. In lesson 5, the emphasis is on
using image analysis software to compute the temperature of an
astronomical object as measured by a radio telescope. Analyses
and results from lesson 4 will be used to complete lesson 5.
The algebraic equations required to perform this exercise
are included in lesson 5.
|
|
Lesson 6: Observation at Different Wavelengths
In the sixth lesson, you will observe the same object(s) at five
different wavelengths in the electromagnetic spectrum. This lesson
uses the NASA website SkyView.
Astronomers often observe the same object at different wavelengths
in order to gather information about the object. According to the laws
of physics, objects radiate at all wavelengths but the intensity of
the radiation varies according to the objects temperature. Some objects
are so faint at certain wavelengths that they appear to be invisible to
the best earth-based telescopes.
|
|
Lesson 7: The Radio Telescope
In this lesson, you will be introduced to the radio telescope
as another tool used by astronomers.
Radio telescopes are designed to collect radio signals
emitted by objects in space. They use large antennas,
accurate pointing programs, and sophisticated analyses tools
to observe and map the objects in the Universe. There is no
mathematical analysis necessary to complete this lesson.
|
|
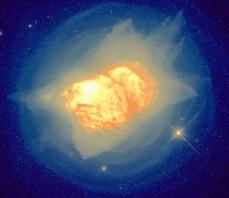
Lesson 8: Mapping Objects with a Radio Telescope
Lesson eight is an explanation of how a radio telescope makes
a map of a region of the sky. The example used in this lesson
is taken from observations of a supernova that occured in
the year 1181 AD. This object continues to be visible as a
reasonably bright radio source. There is no
mathematical analysis necessary to complete this lesson
|
|
Lesson 9: Calibrating a Radio Telescope
Radio telescope data must be calibrated against a known
standard just like any other scientific measurement. This
lesson presents the background necessary to understand
an important task performed by astronomers. The
calibration procedure allows an astronomer at one observatory
to compare the results of his or her data against that same set of data taken by other astronomers at other observatories.
As in the previous lessons, actual data obtained from an
observation of the supernova remnant SNR1181 is used.
There is no mathematical analysis necessary to complete this lesson
|
 We answer questions in the lessons below.
These lessons designed and
tested by high school teacher
Rob Welsh
and astronomer Glen Langston.
We answer questions in the lessons below.
These lessons designed and
tested by high school teacher
Rob Welsh
and astronomer Glen Langston.