Introduction to Science in the Galactic Plane

Lesson 2: Object Identification

Our Galaxy with annotations

PURPOSE

This exercise will allow the instructor/teacher to present to his/her students a lesson on measuring the intensity of the sources obtained from the First Galactic Plane Survey; hereafter known as GPA. A measurement of intensity obtained from this lesson is necessary to ultimately measure the temperature of each source.

INTRODUCTION

The First Galactic Plane Survey is an observation of the plane of the Milky Way Galaxy taken simultaneously at two frequencies in the microwave part of the radio spectrum. The frequencies used are 8.35 GHz and 14.35 GHz in the X- and Ku-bands respectively. Radio intensity maps of the plane of the galaxy were made from the observing data; one for each of the two frequencies observed. The intensity of the various sources recorded by the survey show variations at the two frequencies used. This variation in intensity of the same object at different frequencies is a tool that can be used to identify the type of object. A graph of an object that is a supernova remnants will have a decrease in intensity as the frequency increases; whereas, a graph of an object that has a relatively uniform intensity at the two different frequencies is indicative of a thermal object. A graph of intensity versus frequency for a thermal object follows the classical Gaussian curve. Thermal objects are regions of interstellar hydrogen gas that has been ionized by the ultraviolet radiation from nearby stars. A cloud of ionized hydrogen is called an H II region.

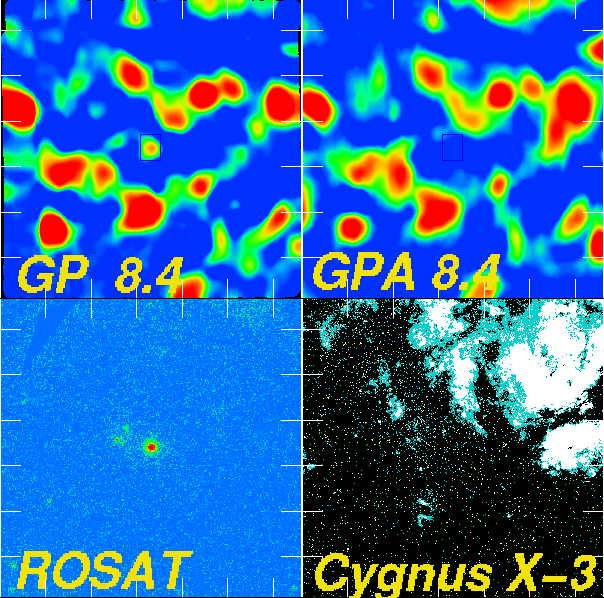
Cygnus X-3 outburst

THE PROJECT

In this project, you will use SKY IMAGE PROCESSOR (SIP) to load and analyze sets of images taken during the GPA survey. The analysis is based on a careful measurement of the intensity of the same object at the two survey frequencies. Those objects that yield a reasonably constant intensity will be classified as thermal objects. Those objects that yield a decreasing intensity as frequency increases will be classified as supernova remnants. Positional data for each identified object will then be obtained. Comparison between your measured position and the true position from astronomical tables will confirm your hypothesis.

DESCRIPTION OF THE DATA

This CDROM contains calibrated radio wavelength images of the Milky Way (our galaxy). These images are obtained by the Green Bank Earth Station, a 45 foot diameter parabolic reflector and radio receiver operating in the microwave part of the radio spectrum. The receiver frequencies are 8.35 GHz and 14.35 GHz. The CDROM contains FITS images as well as software to analyze the images. FITS stands for Flexible Image Transport System. It is the standard format for recording and transmitting astronomical images and data. The images contain information on what part of the sky has been observed and what is the intensity of the radio signal from that part of the sky.

PREREQUISITES

To get the most out of this activity, students should have a basic understanding of the following concepts:
(a) loading image processing software
(b) loading required FITS images
(c) galactic coordinate system
(d) Intensity vs frequency relationship
(e) mathematical analysis

IMAGE PROCESSING INSTRUCTIONS

Recommendation: students work in groups of NO MORE than 3/group; therefore, students are more individualy involved in the research.

The region of interest for the first data analysis is the Cygnus region of the Milky Way. The Cygnus region is one of the spiral arms of our galaxy and is rich in its variety of radio sources.

Review the instructions in Introduction to Image Processing.

1. Load Sky Image Processor (SIP) program.
2. Load FILE cyg-xcal.fit.

To access the Sky Image Processing program, connect to: http:// http://www.phys.vt.edu/~jhs/SIP/

In your data table, record the following information:

Galactic coordinates of source; Sum of pixels per box at each of the two observed frequencies;

DATA TABLE FOR GPA SURVEY OBJECT IDENTIFICATION EXERCISE

Construct a data table that contains the following headings:
1. GALACTIC COORDINATES: [LONGITUDE] [LATITUDE]
2. SUM OF PIXELS/BOX for both [8.35 GHz image] and [14.35 GHz image]
3. RATIO OF SUM OF PIXELS/BOX: [8.35 GHz/14.35 GHz]
4. MAX/BOX: [14.35 GHz]
5. INTENSITY: [14.35 GHz]

ANALYSIS TO BE PERFORMED BY STUDENTS USING SKY IMAGE PROCESSOR

1. The equation shown above will calculate the object flux of each source. Variables used from [SIP] are:

ObFl = object flux; related to source intensity

SumPixBox [freq] = sum of pixels/box at a given frequency

MaxBox [freq] = maximum in box at current frequency; related to source brightness

ObFl=((SumPixBox @ 8.35 GHz)/(SumPixBox @ 14.35 GHz))*(MaxBox)

2. From your data of the Cygnus X3 region, what is the number of thermal sources found?
3. From your data of the Cygnus region, what is the number of supernova remnants found?
4. In an area of 10 by 10 degrees centered on Cygnus X3, use your data of (1) and (2) above to calculate the number of thermal and non-thermal sources per unit area. Do this calculation for both frequencies. This calculation shows the distribution of sources in the Cygnus arm.
5. Create a graph with INTENSITY on the y-axis and FREQUENCY on the x-axis. Use this graph to plot your intensity vs frequency data for each source. Use a scheme of different colors or different shapes to identify each source.
6. Print a map (hard-copy) of the 10 by 10 degree region of Cygnus X3. On your map, use your data table to locate and record the type of object: thermal or supernova remnant. You have now identified certain characteristics of the Cygnus arm of the Milky Way.
7. Does your graph of INTENSITY vs FREQUENCY agree with theory? Explain your answer.

In your next exercise, you will calculate the angular size of each source.

previous up next
Previous Up Next
Galactic Plane Science
2000-06-27

rwelsh@nrao.edu, glangsto@nrao.edu