|
|
This Web Page/CDROM contains calibrated radio wavelength images of the Milky Way (our galaxy). These data have a number of uses, including: |
|
|
|
|
|
This CDROM contains FITS format images, which have all coordinate and calibration measurements, BUT you need a program to display and measured parameters from these images. |
|
|
The steps required to start making progress are:
|
|
|
|
|
|
Robert Welsh has created a series of lessons plans geared to high school level
students, that the students will enjoy. These lesson plans achieve
the goals of:
|
|
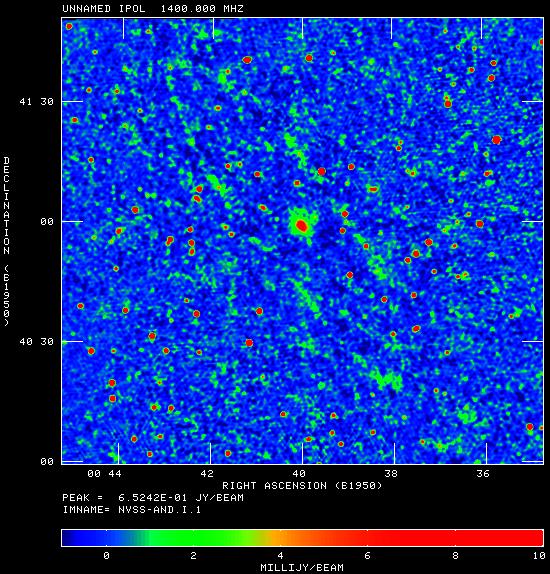
The Cygnus X-3 (a binary star system in our galaxy) exhibited transient emission on 2000 April 20. The binary stars appear as a red peak in the center of one of the images. The radio emission of this region is compared to the Galactic Plane A (GPA) Survey image taken on 1998 September. The brightest emission is in red and faintest emission is in blue. The 2000 April 20 image has a higher noise level than the GPA image. The green emission differences are not significant. The flux density range is 0 to 7 Janskies at 8.35 GHz. The maps show a complex region of our galaxy, called the Cygnus Loop. Cygnus X-3 is located at galactic latitude 0.7005d, longitude 79.8455 (J2000 Ra 20h32m25.70s, Dec 40d57'28.0", 308.1071d, 40.9578d) |

|
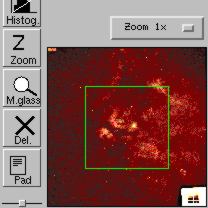
The Sky Image Processor program written by John Simonetti at Virginia Polytechnic Institute and State University is very useful for viewing FITS images, and for measuring the intensities of radio sources. The latest version is available online from the author. A copy of version 2.10 of the software is also contained on this disk. |
|
FITSview programs are available
for displaying GPA data. These programs, written by
Bill Cotton
are available for a variety of platforms and are very useful for
studying images provided in FITS format.
For the convenience of WIN95/WIN98/WINNT users, copies
of the
executable and
help file are placed
in the fitsview top directory.
For the convenience of RedHat Linux users, a copy of
of the
executable is placed
in the fitsview top directory.
The Northern VLA Sky Survey provides FITS format images over the entire sky north of -40 degrees declination.
|
|
The
Aladin JAVA software is very useful for viewing FITS images, but
must be down-loaded and installed to allow access of local FITS images.
The binary files for Aladin are available on this disk for
/95/98/NT
|
|
The GPA observations were made using the Orbiting VLBI tracking station in Green Bank, West Virginia. The station is one of four NASA tracking stations dedicated to support of the space vlbi missions in Japan and Russia. The HALCA satellite is used to study the properties of jets of material ejected from the region surrounding black holes at the centers of distant galaxies. |
|
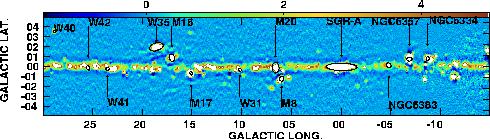
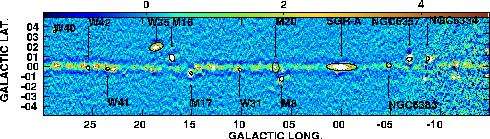
The 10 GHz survey of Handa, Sofue, Nakai, Hirabayashi and Inoue 1987, (Publ. Astron. Soc. Japan, Volume 39, pages 708-754) covers a region of the galactic plane, 355 < l < 56, -1.5 < b < 1.5, with high sensitivity at 10 GHz. Their FITS format images, calibrated in units of Jy/Beam are available in increments of two degrees galactic longitude. The fits files are centered on 356d , 358d , 0d , 2d , 4d , 6d , 8d , 10d , 12d , 14d , 16d , 18d , 20d , 22d , 24d , 26d , 28d , 30d , 32d , 34d , 36d , 38d , 40d , 42d , 44d , 46d , 48d , 50d , 52d , 54d and 56d . |
The GPA data are provided by the National Radio Astronomy Observatory (NRAO), a facility of the National Science Foundation operated under cooperative agreement with the Associated Universities, Inc.
glangsto@nrao.edu Last update: 2000 March 22