Introduction to Science in the Galactic Plane
Lesson 9:The Calibrating Radio Data

 QUESTION: How is Radio Telescope Data Calibrated?
After the radio measurements are made, they must be processed to distinguish true astronomical observations from effects due to the environment and equipment used in making the observations. The process of conversion and calibration is done in several steps. The goal is to convert to measurements to standard units so that observations made by different astronomers can be compared and scientific deductions made.
For the GPA survey, calibration is done in several steps. The first step is conversion is to convert from detector units of volts to measurements of the temperature. This is done by injecting a calibration signal of known temperature (measured in a laboratory) into the receiver. Then detector output is measured and the ratio of known temperature to detected output is used to convert Volts to Temperature.
After conversion to temperature calculations are made to fit a model of the sky and receiver contributions to the measurements.
The next calibration step is to determine the brightness temperature of a very compact radio source of known Flux Density (Janskys). Radio Astronomers use the unit Janskys to compare their results. One Jansky is 0.000000000000000000000000001 Watts/meter^2/Hz which is a very small value.

|
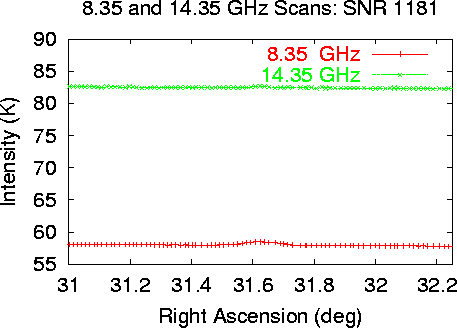
This graph shows part of a single scan of the sky centered on SNR 1181.
The X axis is the Right Ascension coordinate, which indicates
where the telescope was pointing. The Y axis shows the
total system temperature measured by each of two receivers, one with a
center frequency of 8.35 GHz (3.6 centimeter wavelength, red) and
14.35 GHz (2.1 centimeter wavelength, green).
Notice that there is only a very small variation in the system temperature measured along the scan. This is because astronomical object contribute a very small amount to the total detected power. |
| Receiver | Receiver Noise adds temperature to the measurments (lower noise recievers are better). For the GPA survey, both receivers have a temperature of about 45 Kelvins. This temperature is independent of the direction the telescope points and is easy to calibrate and remove. |
| Sky | Sky brightness adds temperature due to water vapor in the air. Water vapor (clouds) both absorbs radio waves and warm. In perfect weather, the sky temperature is about 6 degrees. In bad weather the sky can add over 100 degrees. Also clouds are clumpy and have different temperatures in different directions, which makes them difficult to calibrate. Useful survey data can only be obtained at these wavelengths when the weather is very clear. |
| Cosmic | A significant component to all measurements of the brightness of radio sources is the Cosmic Background radiation, which is the remaining emission from the Big Bang beginning of the Universe. This Cosmic Background Radiation is very similar in all directions of the sky and adds 2.7 Kelvins to all measurements. |

|
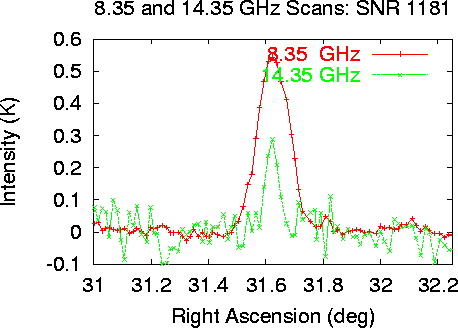
The sky brightness and receiver temperature components of the
measurements are removed by fitting a curve to the ends of the measurements
of brightness and subtracting this fit.
The source SNR 1181 is clearly visible in these plots after removing the other effects. Notice that SNR 1181 is brighter at 8.35 GHz than 14.35 GHz. Also notice the noise in the scan is greater in the 14.35 GHz data. This is because the sky contribution to the 14.35 GHz data is much greater. |
For the GPA survey, the brightness temperatures were converted to Janskies by observations of a number of compact bright radio sources with known Flux Densities. These sources are listed below:
| Cassiopiea | Supernova remnant |
| Cygnus A | Radio Galaxy |
| NGC 7027 | Planetary Nebula |
| 3C 286 | Distant Quasar |

|
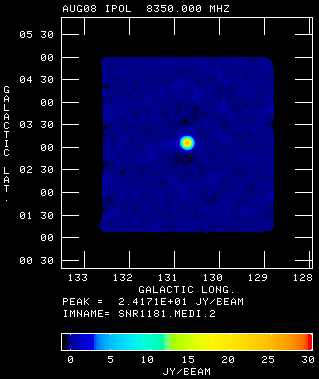
After calibration, the measurements are averages and placed on a grid and
a map of the region is produced, with units of Janskies.
The final GPA maps are produced by averaging four independent images of the same regions of the sky. This process reduces the noise in the observations and provides a way of removing isolated errors in the images, such as bad weather. |
|
|
|
|
| Previous | Up | Next |
2000-08-10