nraonrao
*/
  Wednesday, February 13, 2008 
  NRAO Green Bank > RFI Protection Group > GBT RFI Archives

GBT Radio Frequency Interference

Introduction

The Green Bank Radio Frequency Interference (RFI) Protection Group would like to offer two primary tools to observers for the purposes of RFI avoidance and mitigation. One of these tools is an archive of RFI scans which will give the observer an idea of spectral occupancy as seen by the GBT receivers themselves, and (eventually) from the GBT RFI Monitoring Station (pictured right).

The second, still under construction, will be a RFI Database which provides details on persistent, identified RFI sources including coordination information where applicable.  For now, we have a Table of Known RFI Sources and a number of Older Surveys and Band Summaries  linked below.

To maximize your chances of RFI avoidance, we advise the following:
1) Consult the latest GBT RFI plots to determine whether the spectrum you wish to observe is typically clear, or occupied by RFI.
2) Consult the Table of Known RFI Sources and/or the Surveys and Band Summaries  to determine whether the source of the RFI is well known and/or likely to be something we can coordinate with (broadcast television, for instance, isn't going to coordinate with us).
3) Contact a member of the Green Bank RFI Group to determine whether coordination is possible. If it is, you will need to obtain a fixed window from the dynamic scheduling group for your observation, and the RFI group can then arrange coordination.

Usually, by the time RFI is experienced during observation, it is too late to do anything about it, but it is still worth reporting, in case it can be mitigated in advance of future observations.

For additional information email interference@nrao.edu.


GBT Receiver Plots by Band

RFI scans are performed routinely by the operators during gaps between astronomical observations. All GBT RFI data is permanently stored as .fits files at:
/home/gbtdata/TRFI_MMDDYY_RN where MM is "number" for the month, DD is the day of the month, YY is the last two digits of the year, R is the receiver letter designation (see below) and N is the session number for that particular day (1,2, 3 etc.)

Prime Focus 1 340 MHz   R=3
Prime Focus 1 450 MHz   R=4
Prime Focus 1 600 MHz   R=6
Prime Focus 1 800 MHz   R=8
Prime Focus 2 R=P
L Band R=L
S Band R=S
C Band R=C
X Band R=X
Ku Band R=U
Ka Band R=A
KFPA R=K
Q Band R=Q
W band R=W

The RFI group routinely (weekly) creates plots from the most recent RFI scans and displays them here. Previous plots may be re-generated from the GBT archives using GBTIDL.


Prime Focus 1-1 3(0.29 to 0.395 GHz)

  • Latest interference plots

Prime Focus 1-2 4(0.385 to 0.520 GHz)

  • Latest interference plots

Prime Focus 1-3 6(0.51 to 0.69 GHz)

  • Latest interference plots

Prime Focus 1-4 8(0.68 to 0.92 GHz)

  • Latest interference plots

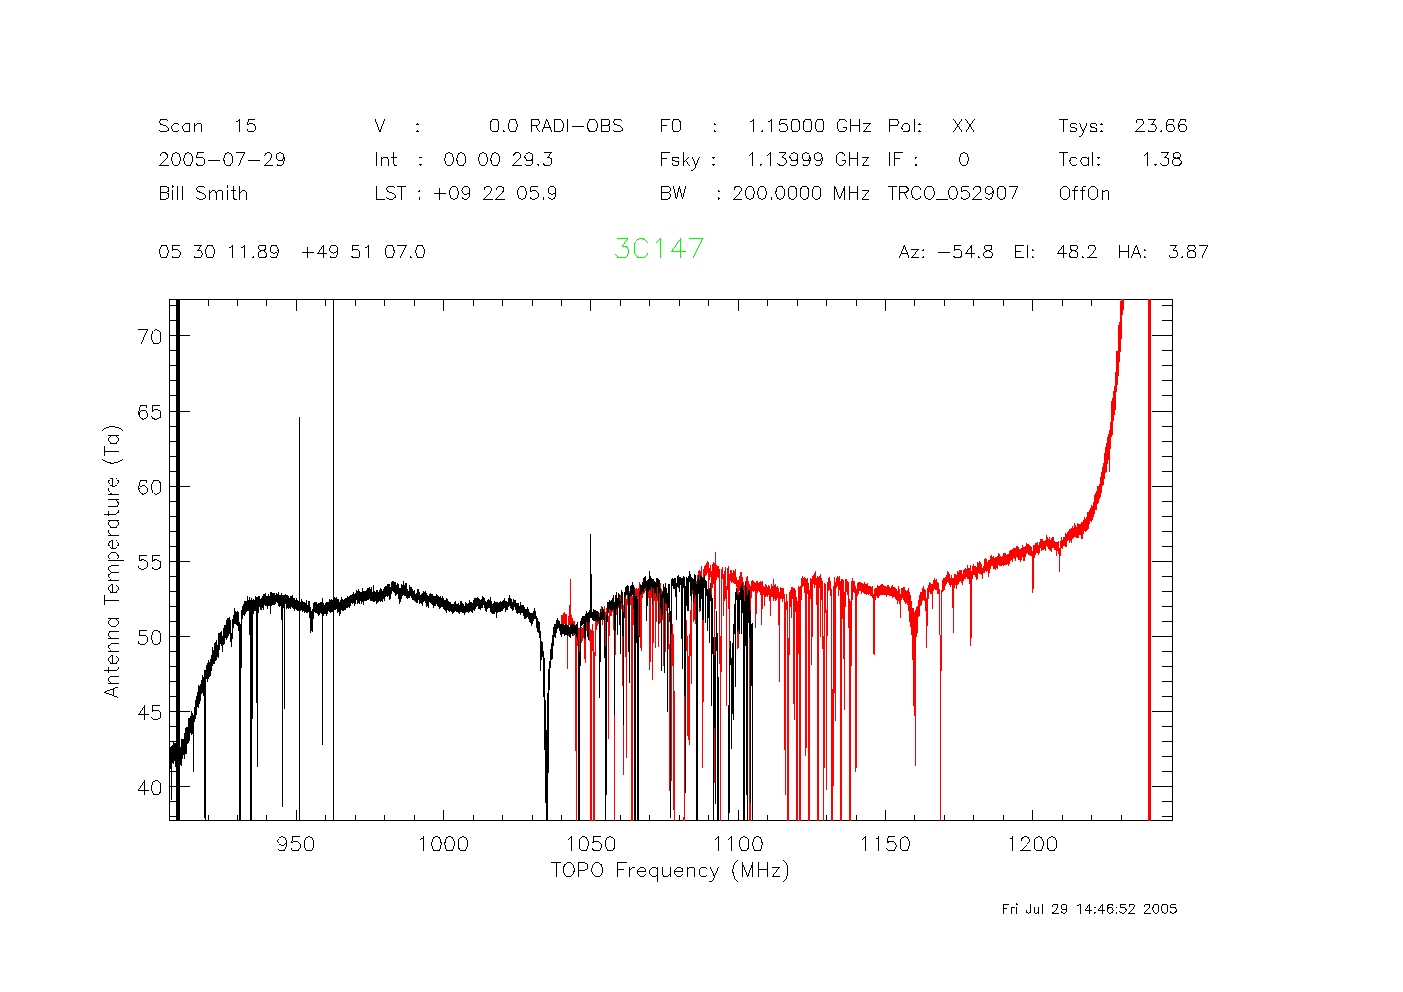
Prime Focus 2 P(0.91 to 1.23 GHz)

  • Latest interference plots

Gregorian L Band (1.15 to 1.73 GHz)

  • Latest interference plots

Gregorian S Band (1.73 to 2.6 GHz)

  • Latest interference plots

Gregorian C Band (3.95 to 5.85 GHz)

  • Latest interference plots

Gregorian X Band (8.2 to 10.0 GHz)

  • Latest interference plots

Gregorian Ku Band (12.4 to 15.4 GHz)

  • Latest interference plots

K-Band Focal Plane Array(17.6 to 24.3 GHz)

  • Latest interference plots

Gregorian Ka Band (26.5 to 40 GHz)

  • Latest interference plots

Gregorian Q-Band(40.0 to 50.0 GHz)

  • Latest interference plots

Gregorian W-Band (68.0 to 92.0 GHz)

  • Latest interference plots

GBT RFI Monitoring Station Plots by Band

This portion of the web page UNDER CONSTRUCTION.

Low Band Omnidirectional Antenna (130-1300MHz)

  • Latest GBTRFIMS .
  • timeline of GBTRFIMS interference plots.
  • Previous GBTRFIMS plots

High Band Omnidirectional Antenna (130-1300MHz)

  • Latest GBTRFIMS .
  • timeline of GBTRFIMS interference plots.
  • Previous GBTRFIMS plots

Low Band Directional Antenna (130-1300MHz)

  • Latest GBTRFIMS .
  • timeline of GBTRFIMS interference plots.
  • Previous GBTRFIMS plots

High Band Directional Antenna (130-1300MHz)

  • Latest GBTRFIMS .
  • timeline of GBTRFIMS interference plots.
  • Previous GBTRFIMS plots

Older Surveys and Band Summaries

Survey
 Survey Date 
Monitored From

100-1450 MHz (selected bands)

12/14/2007
GBT RFI Monitoring Station
125 to 200 MHz
03/19/2004
40-ft. RFI Monitoring Station
195 - 1425 MHz  06/14/2006
43m Telescope
280-390 MHz (PF1-1)
05/01/2003
GBT
280-900 MHz (PF Rxs)
05/25/2003 - 02/24/2004
GBT
290-395 MHz (PF1-1) 11/05/2008
GBT
380-520 MHz
01/26/2002
GBT
385 - 470 MHz
10/19/2003
spectrum summary
385-470 MHz (PF1-2)
10/19/2003
GBT

385-520 MHz (PF1-2)

11/17/2004
GBT
600 MHz
08/28/2003
GBT
510-690 MHz (PF1-3) 11/01/2005
GBT

680 - 920 MHz (PF1-4)

07/08/2004
GBT
902 - 1240 MHz
04/05/2004
40-ft. RFI Monitoring Station

910 - 1230 MHz (PF2)

07/29/2005
GBT
L band (1.07-1.87 GHz) 02/15/2003
GBT
S band (1.7 - 2.6 GHz) 02/25/2002
GBT
S band (1.8 - 2.6 GHz) 11/16/2003
GBT
3950 - 5850 MHz  (C band) 12/15/2004
spectrum summary
C band Summary Report 05/01/2007
spectrum summary
C & Ku band RFI Report 10/05/2005
GBT
X-Band Spectrum Summary
11/23/2005
40-ft. RFI Monitoring Station
K band Spectrum Summary
12/15/2004 spectrum summary 

12.4 - 15.4 GHz (Ku band)

04/8/2004
GBT
12.4 - 15.4 GHz  (Ku band) Spectrum Summary
12/15/2004 spectrum summary 


Known Sources Database

Database UNDER CONSTRUCTION Table of Known RFI Sources is available.
Home | Contact Us | Directories | Site Map | Help | Policies | Search