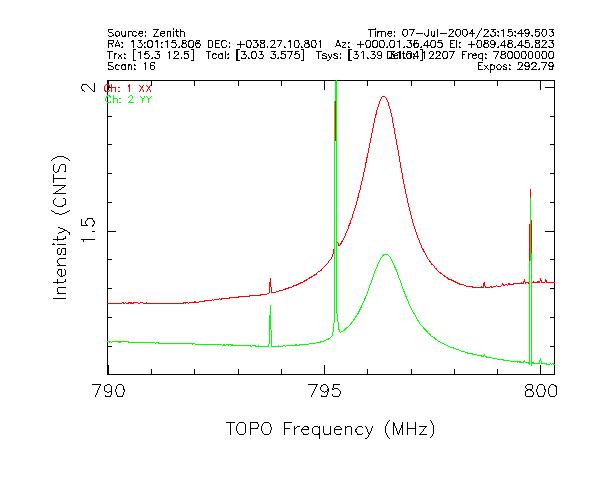
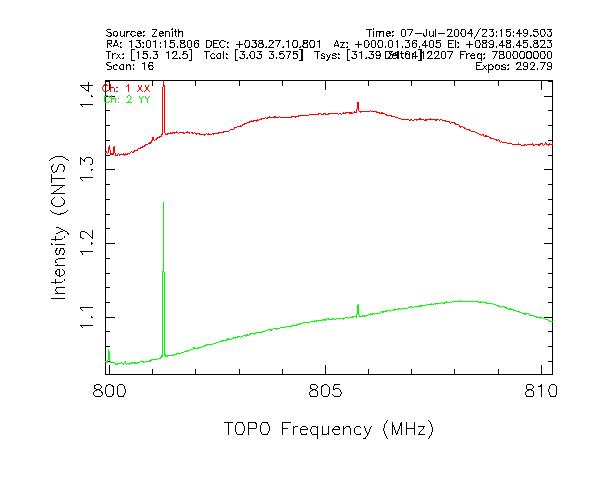
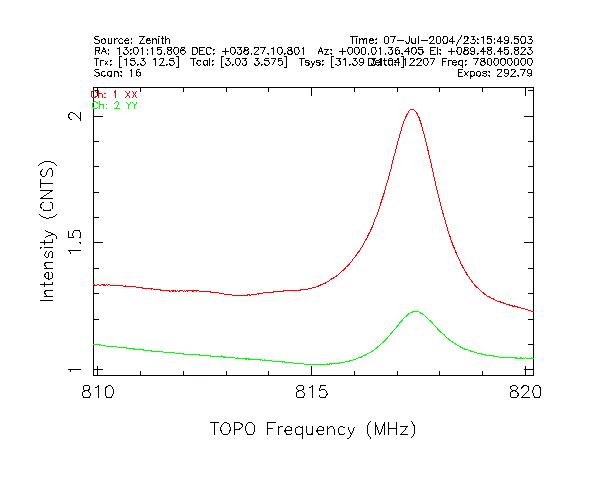
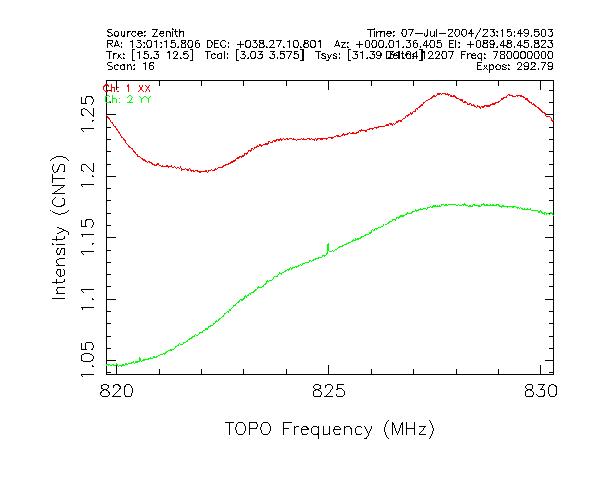
Observations
On July 7-8, 2004 GBT receiver checkout observations were performed for
the PF1 800 MHz band receiver. Serveral scans to identify RFI in the
nominal receiver bandpass were made as part of these observations. The
spectrometer was used for these observations. The spectrometer was setup
to provide 200 MHz instantaneous bandwidths in two separate
bandpasses. The two bands had center frequencies of 780 MHz and 820 MHz
allowing the whole 800 MHz receiver bandpass to be cover instantaneously.
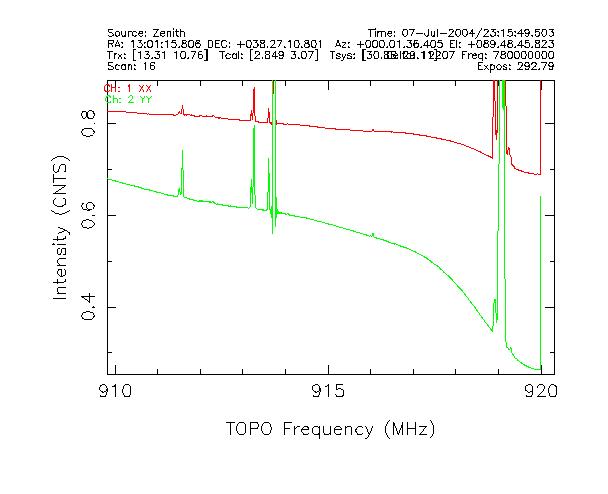
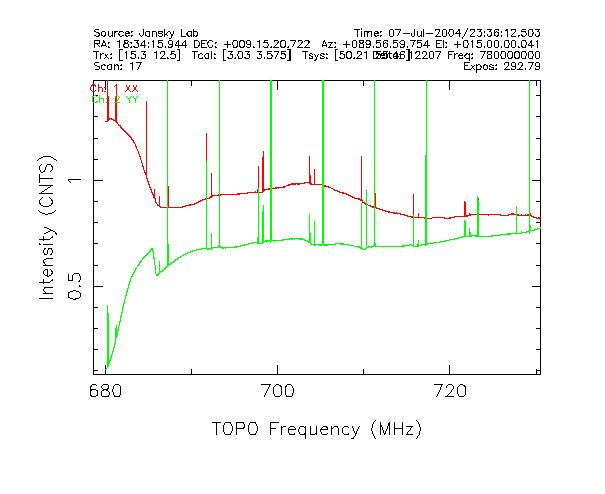
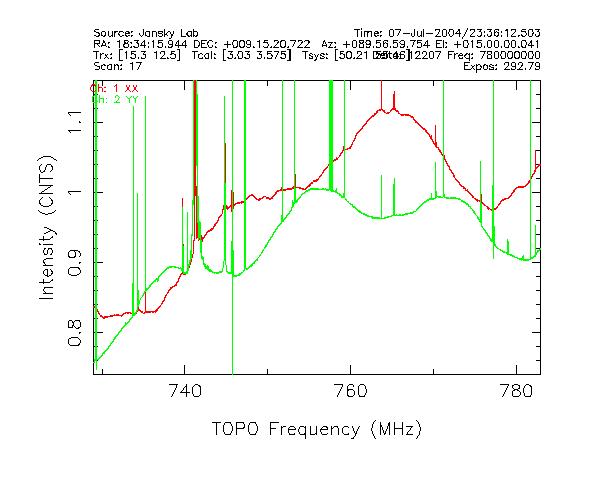
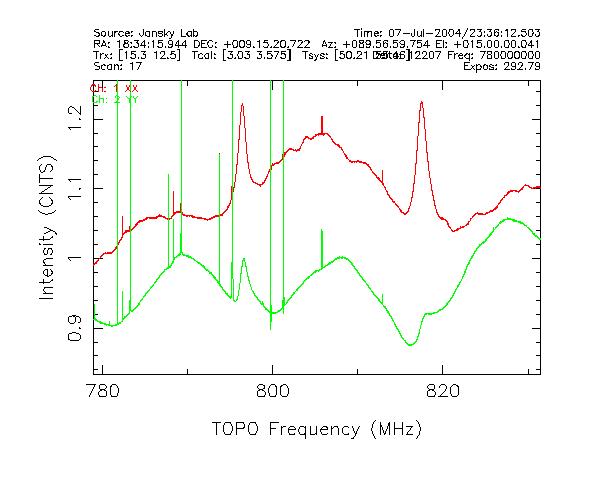
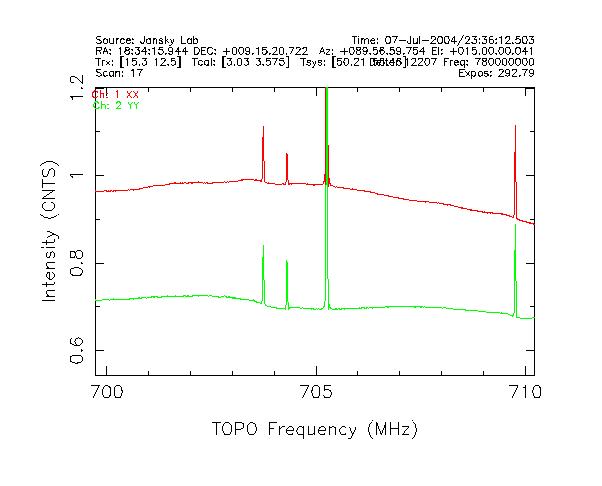
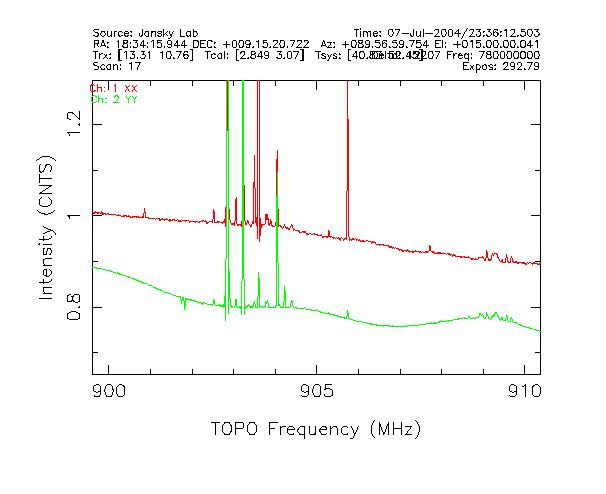
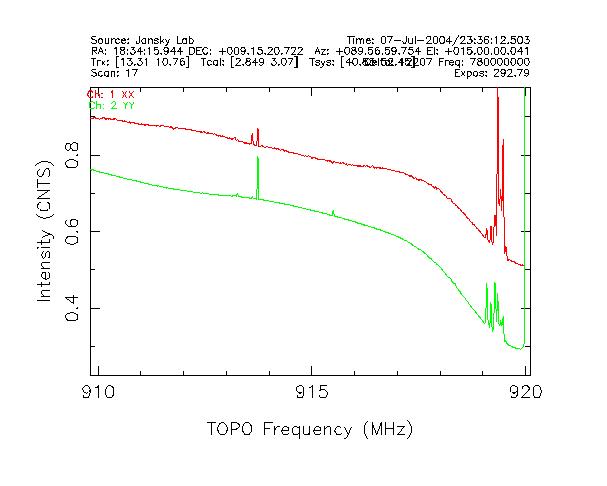
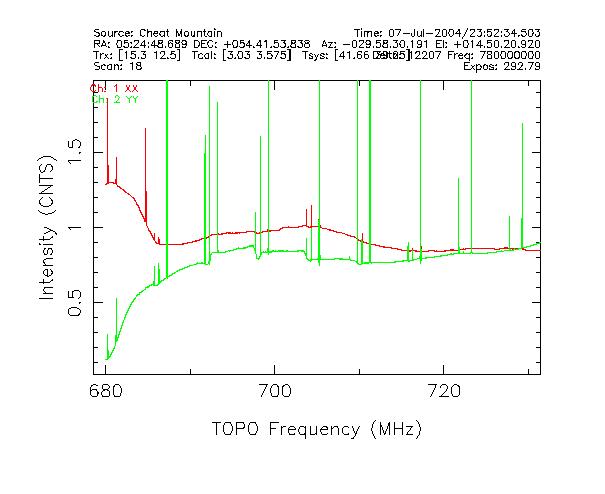
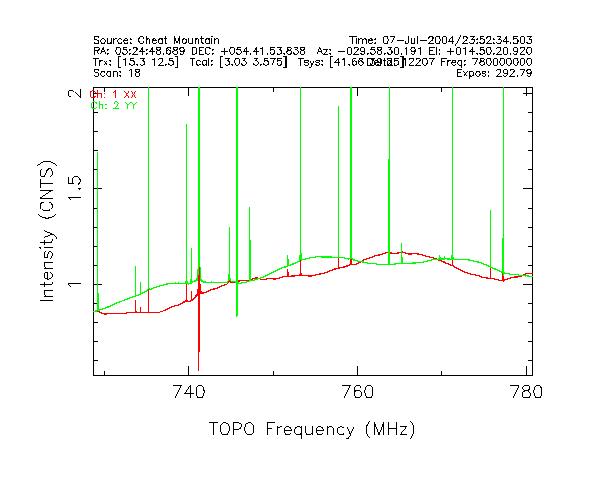
Pointed observations were made at the Zenith (Az=130, El=90), towards
the Jansky Lab (Az=90, El=15) and towards Cheat Mountain (Az=330, El=15).
Horizon scans were taken where the GBT was moved from 0 degrees azimuth to
360 degrees azimuth at a constant elevation of 15 degrees. The telescope
was slewed at 30 degrees per minute in azimuth and a 3 second integration
time was used.
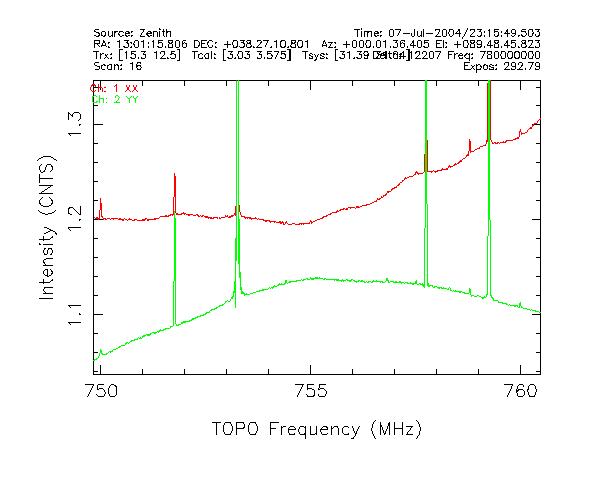
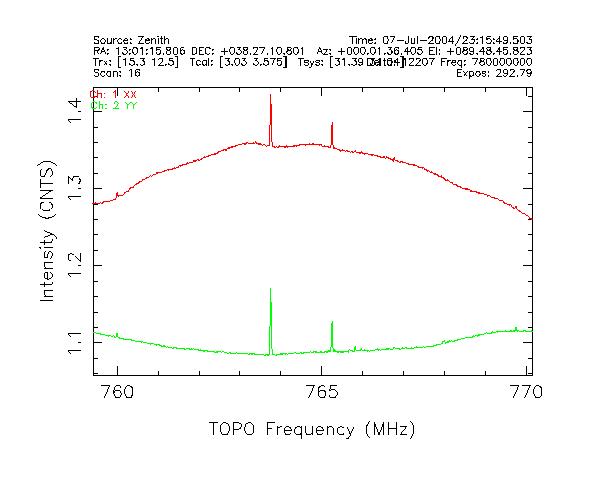
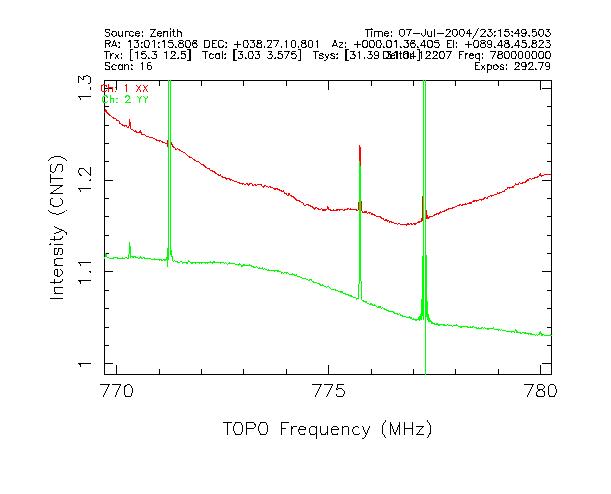
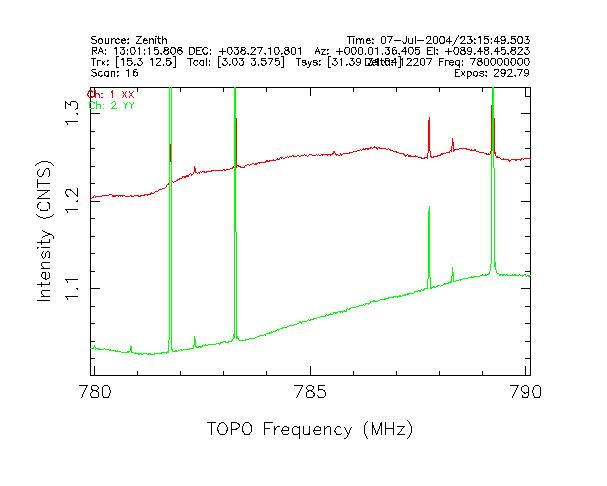
I have not attempted to calibrate the data. Only raw data from the
"cal off" phase is shown.
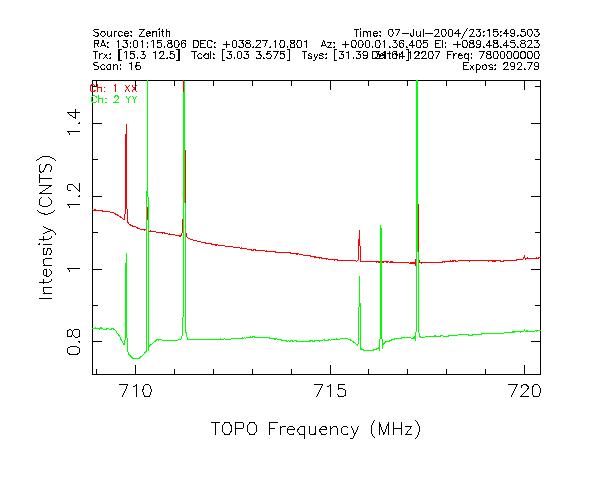
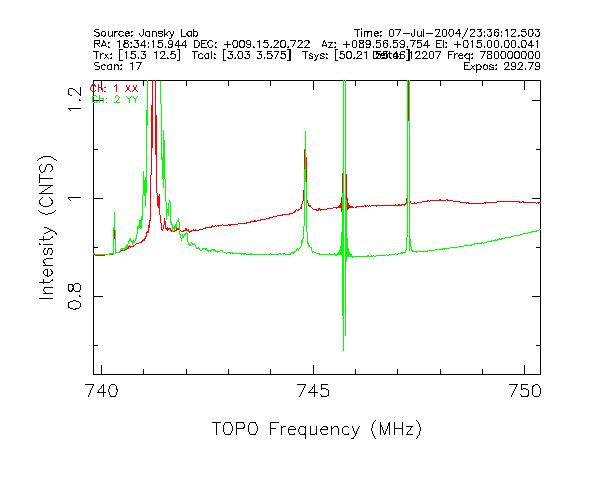
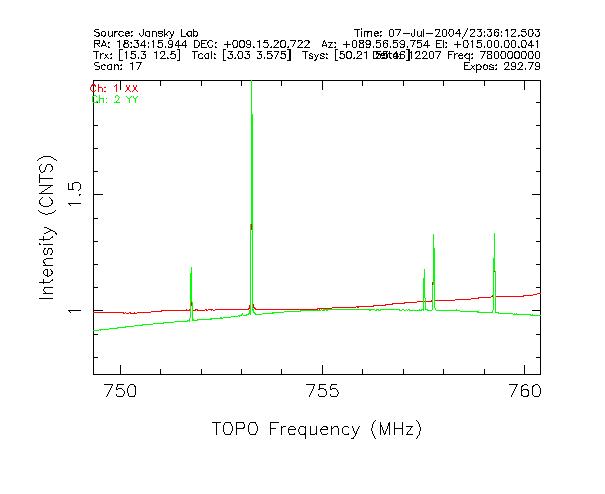
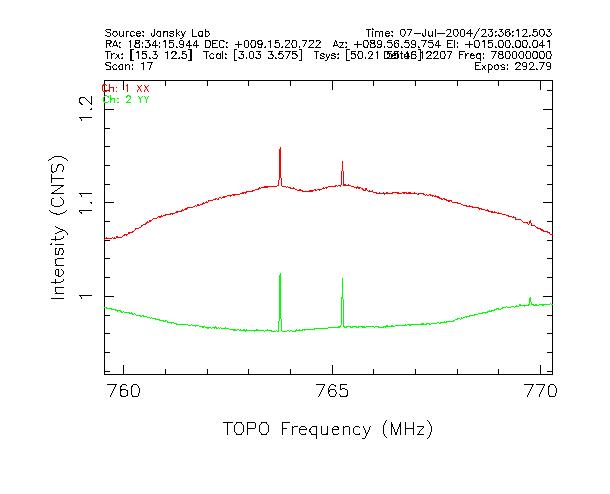
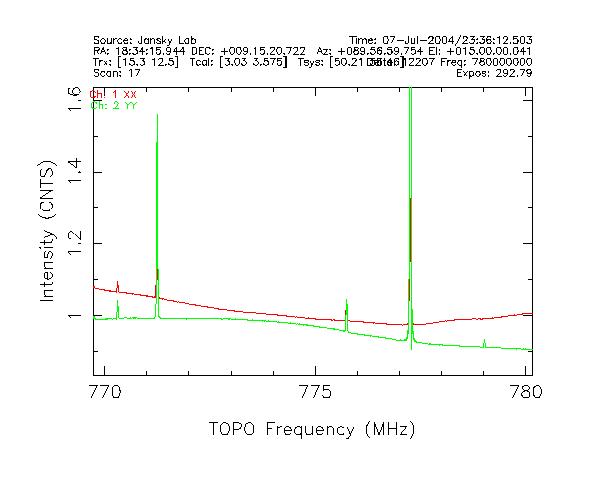
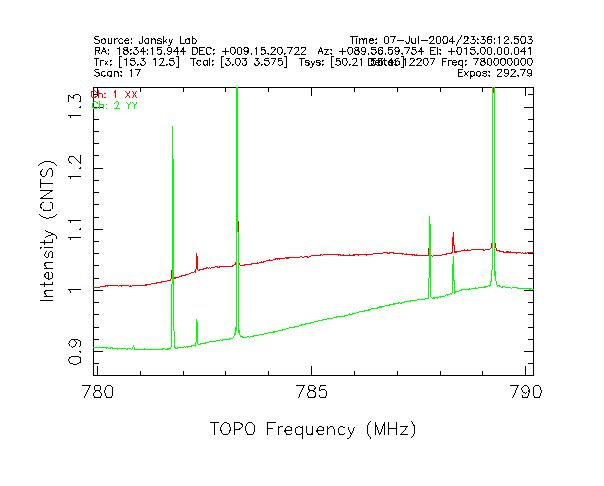
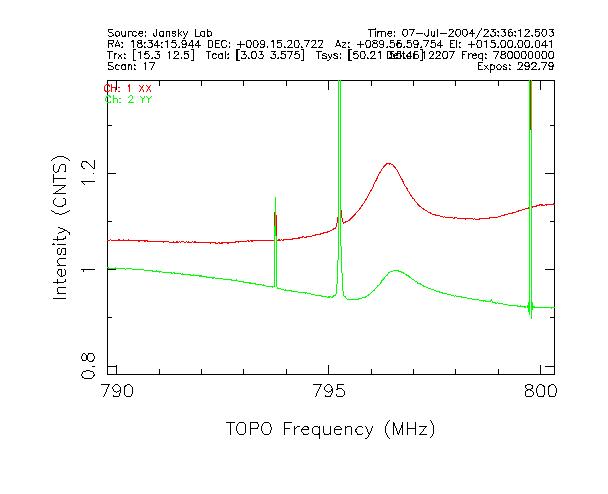
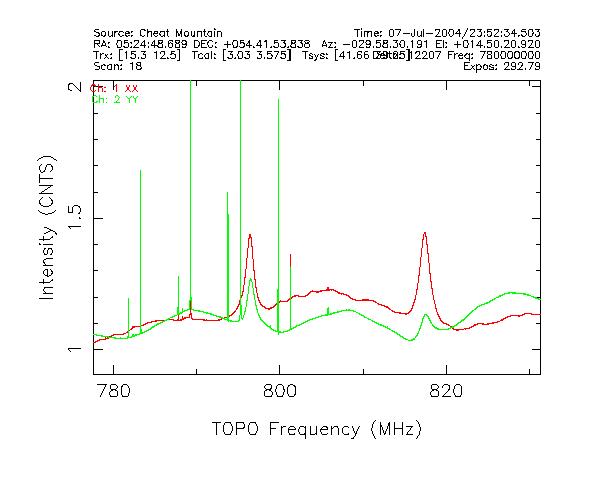
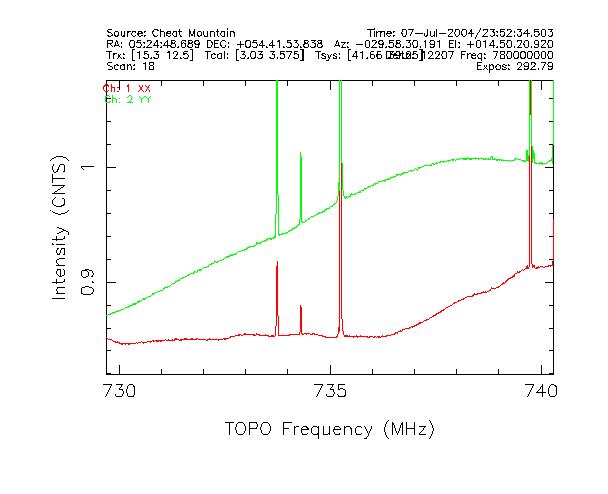
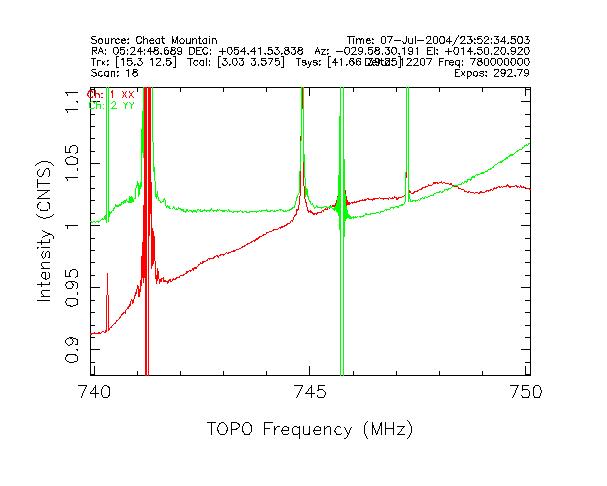
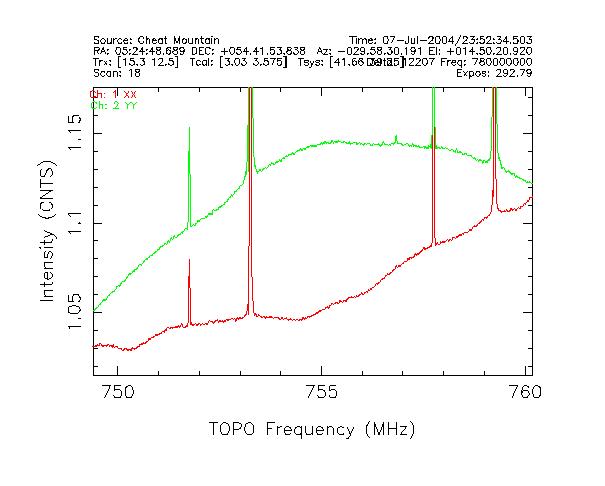
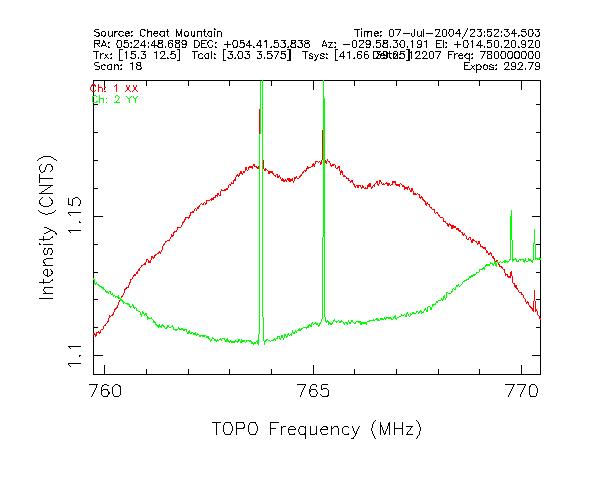
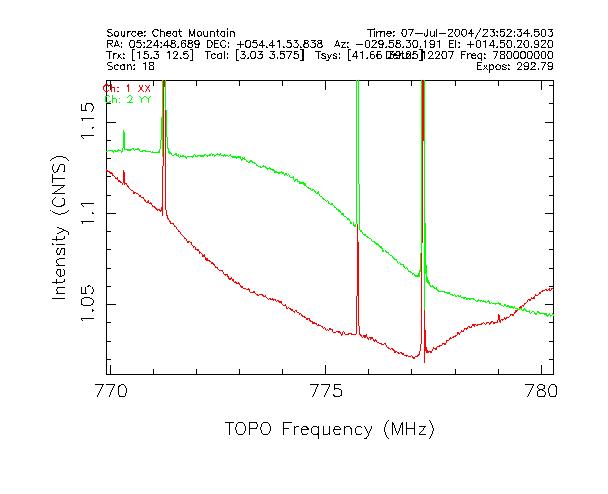
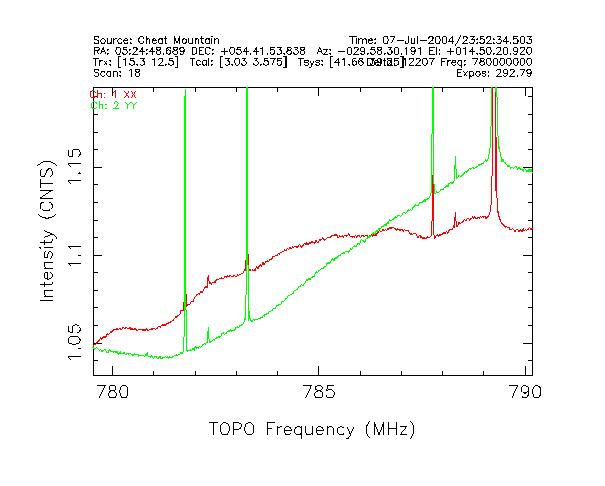
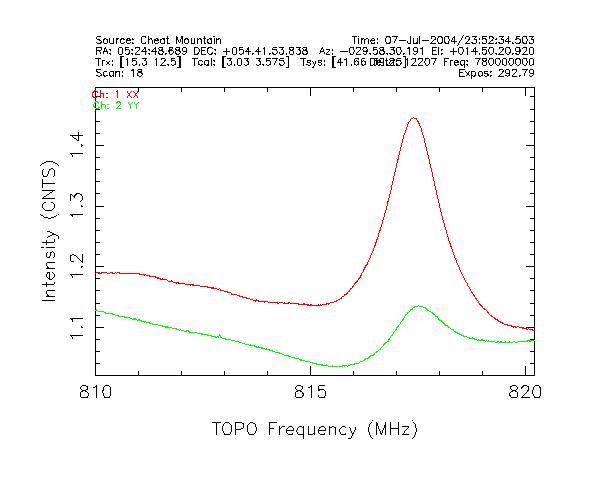
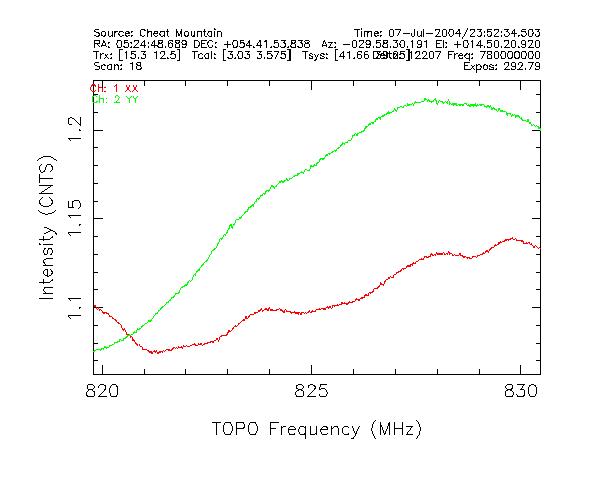
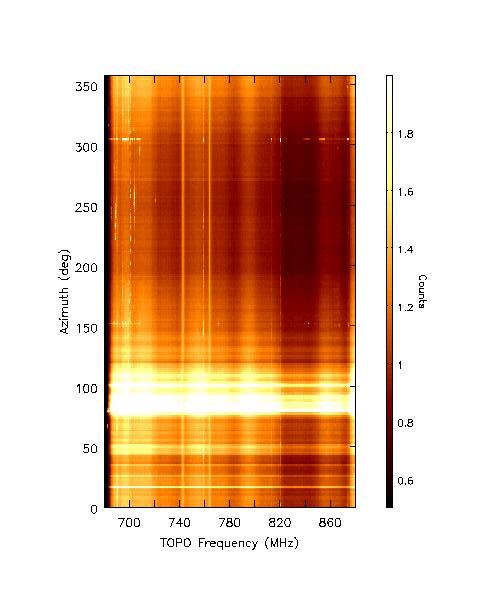
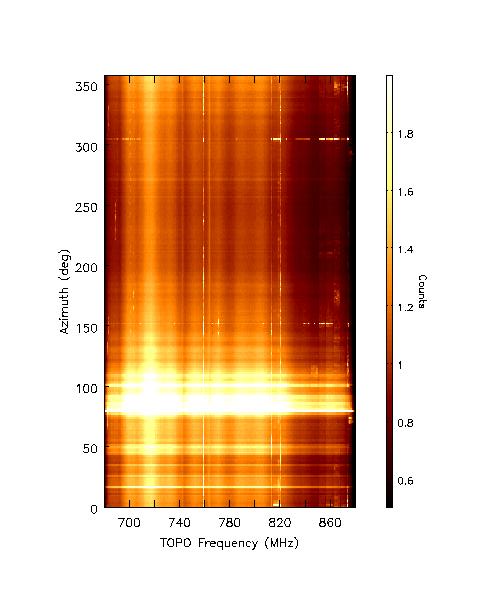
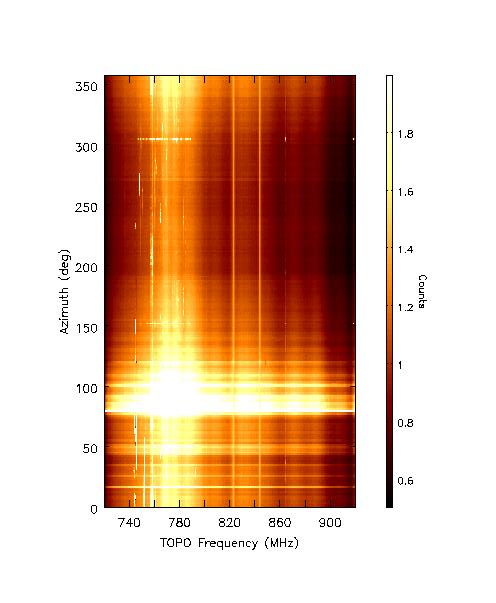
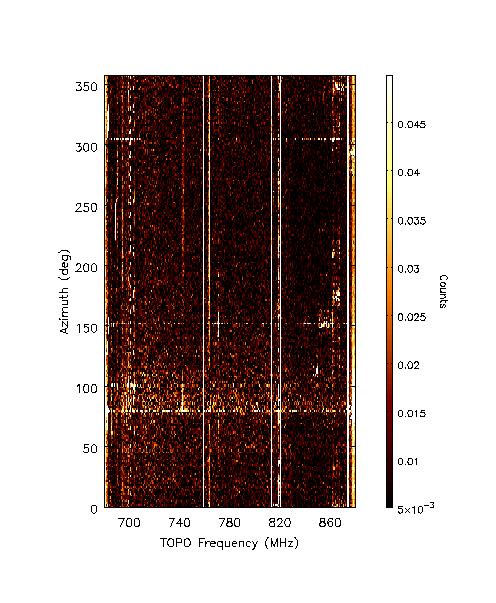
Horizon Scans
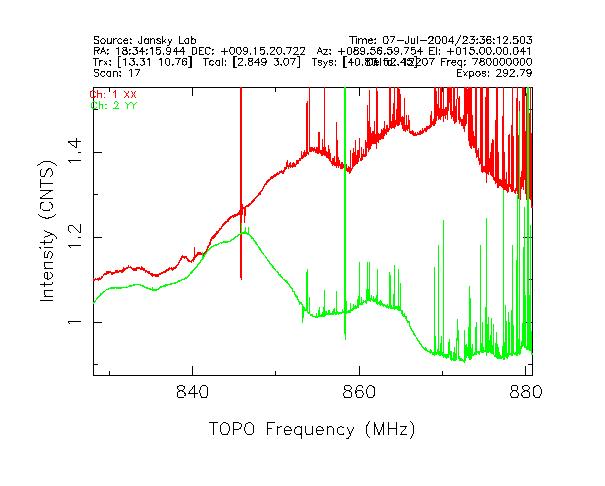
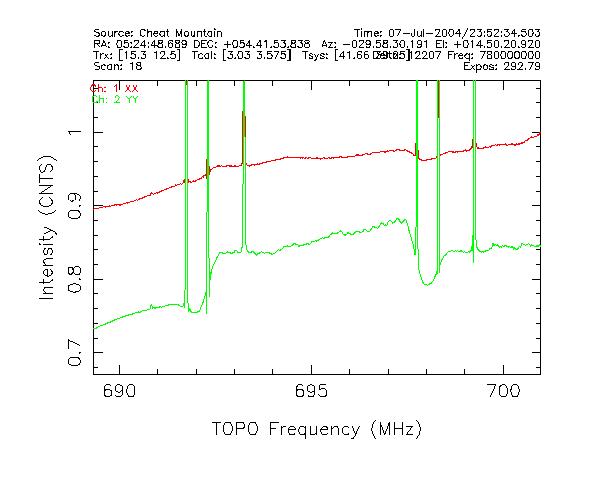
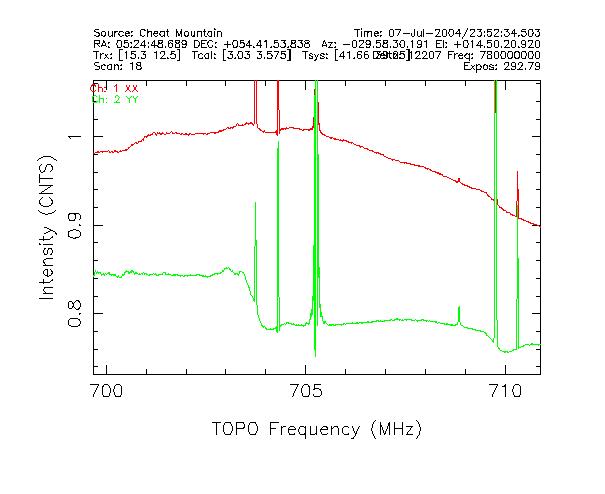
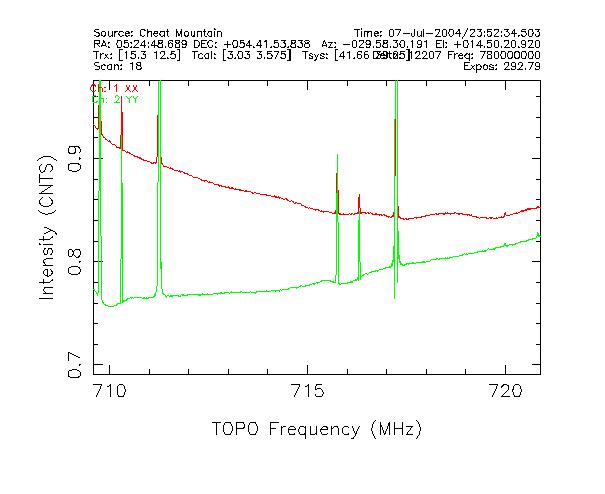
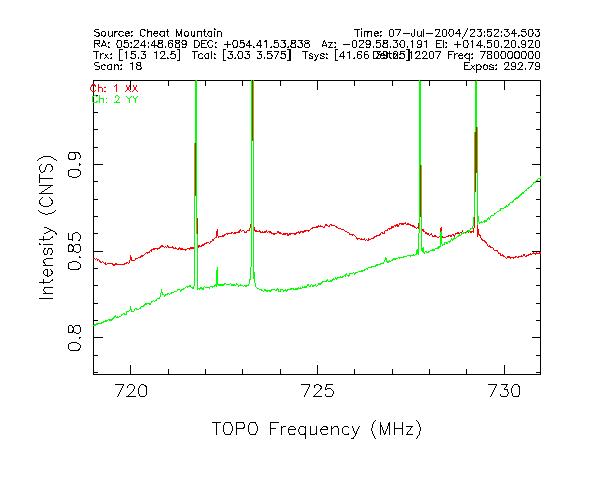
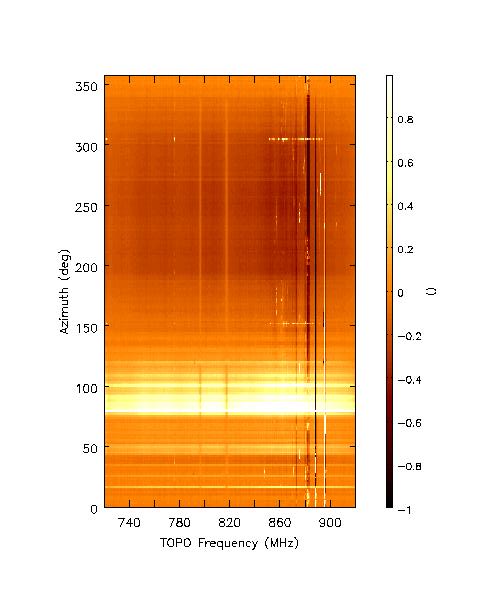
The images below (Figures 88 and 89) show the raw data for each
polarization. These data still contain the receiver bandpass
which shows up as the broad (greater than about 5 to 10 MHz)
undulations in frequency. Only the brightest RFI show up
in these plots.
The bright emission around an Azimuth of 90 degrees is from the
Jansky Lab, surrounding buildings and Arbovale. The bright emission around
50 degrees Azimuth is from the area of the 140 Foot Telescope. (Could
the 140 Foot area really be a reflection of the Jansky Lab area off
of the 140 Foot and into the GBT?)
 |
 |
|
Figure 88 Click on image for postscript version.
X (left) and Y (right) polarizations. 200 MHz bandwidth centered on 780 MHz.
|
 |
 |
|
Figure 89 Click on image for postscript version.
X (left) and Y (right) polarizations. 200 MHz bandwidth centered on 820 MHz.
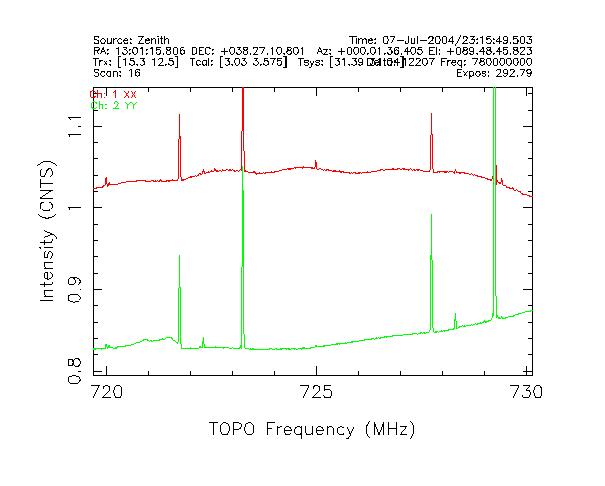
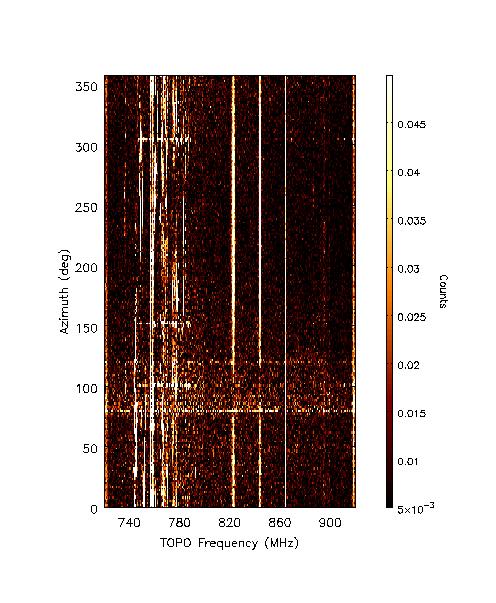
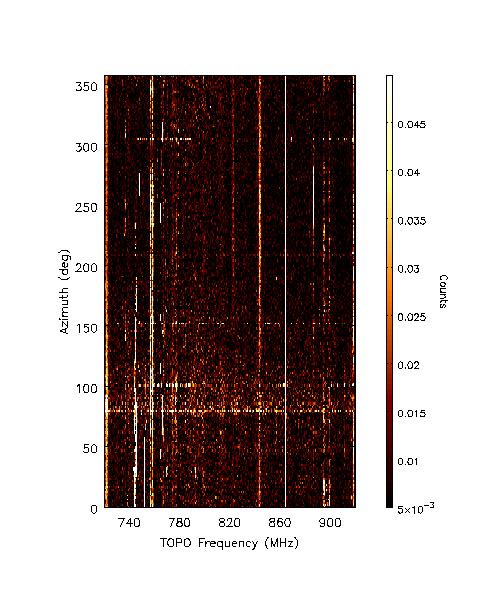
|
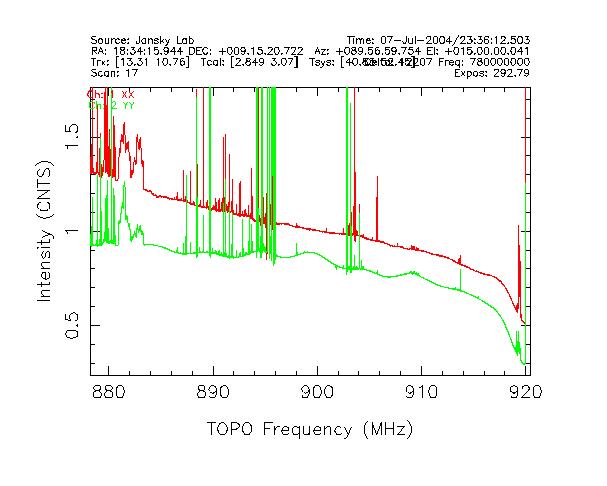
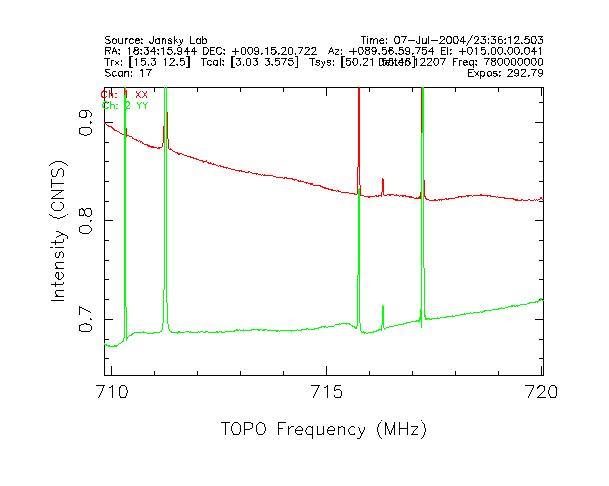
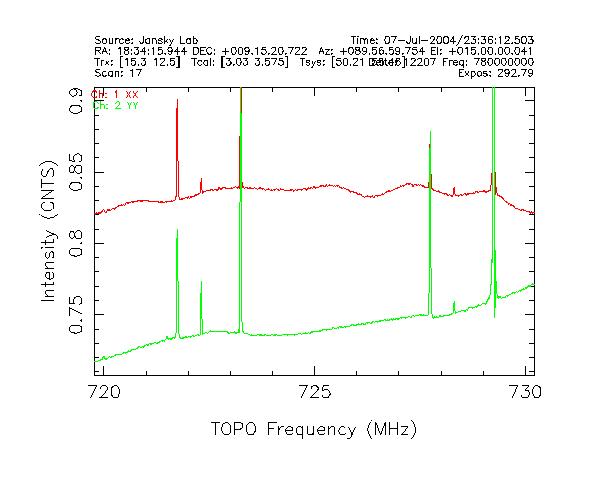
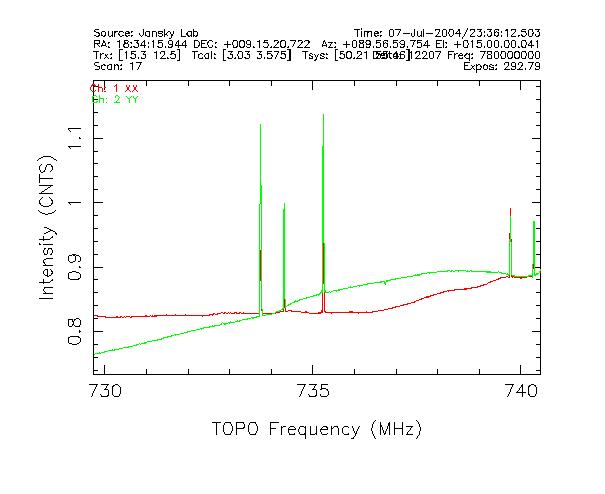
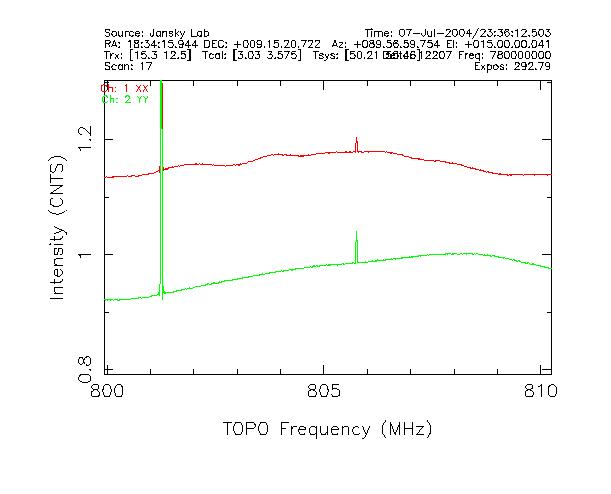
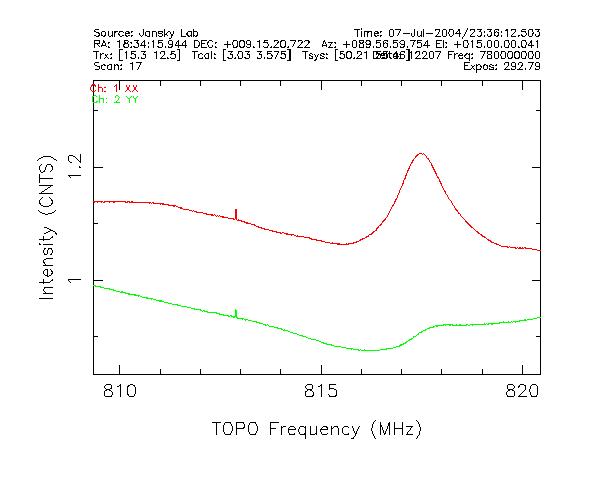
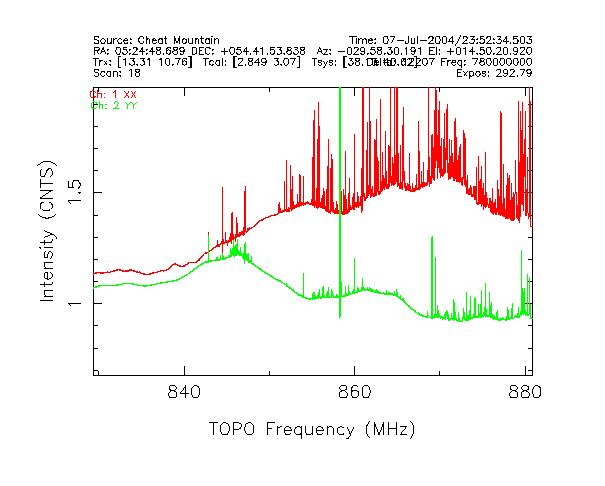
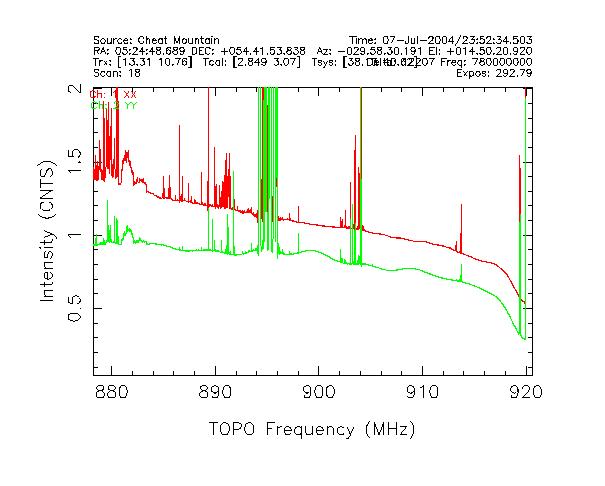
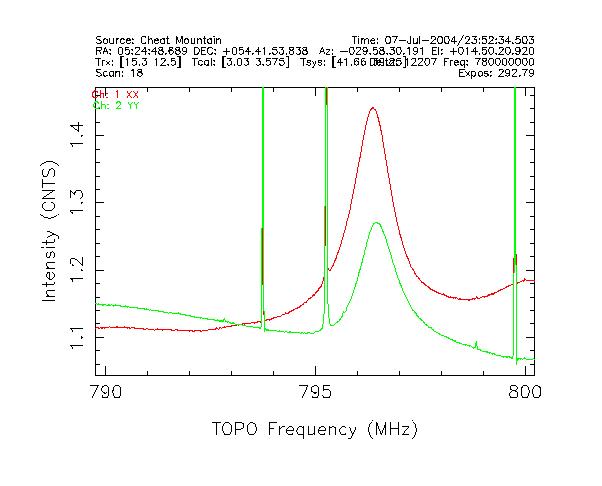
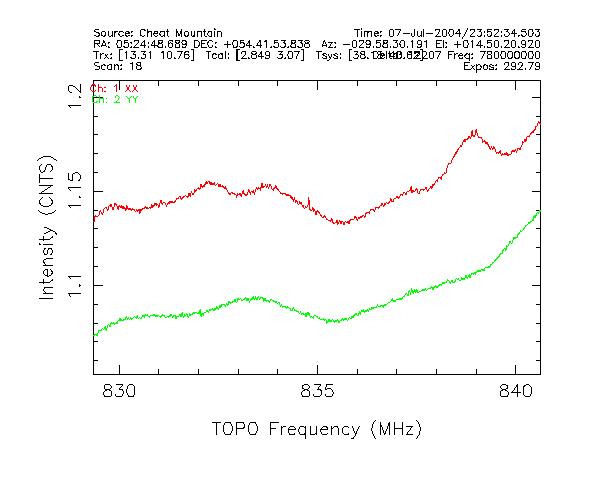
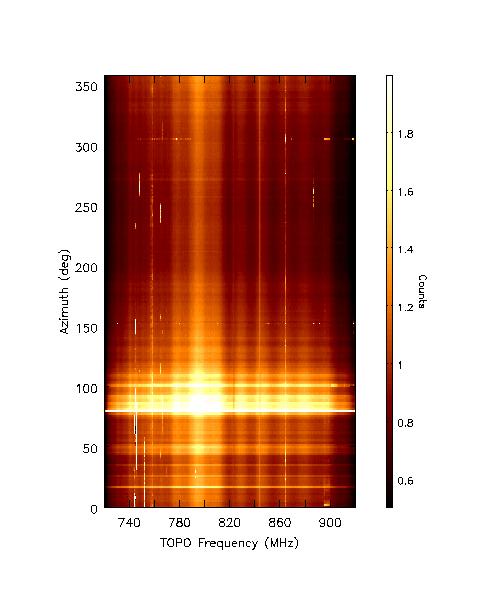
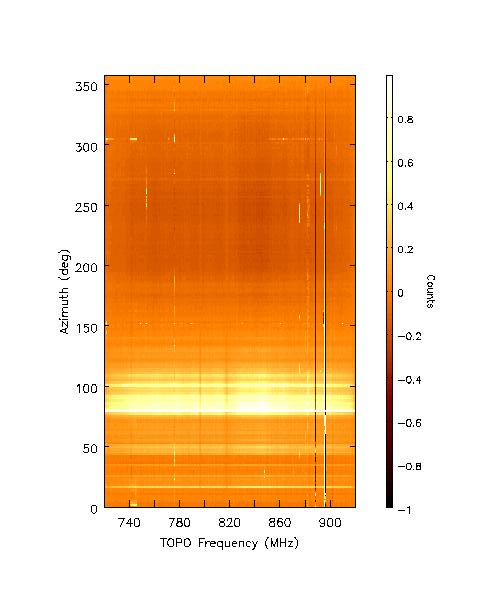
Figures 90 and 91 show the data for each
polarization where the receiver bandpass has been subtracted.
This was done by ordering the data within 25 frequency channels
on each side of a point and taking the 10th lowest value as the baseline
level for that point.
This removes most of the baseline except for areas where the baseline
has large gradients - such as the bandpass feature near 817 MHz.
 |
 |
|
Figure 90 Click on image for postscript version.
X (left) and Y (right) polarizations. 200 MHz bandwidth centered on 780 MHz.
Baseline has been removed.
|
 |
 |
|
Figure 91 Click on image for postscript version.
X (left) and Y (right) polarizations. 200 MHz bandwidth centered on 820 MHz.
Baseline has been removed.
|
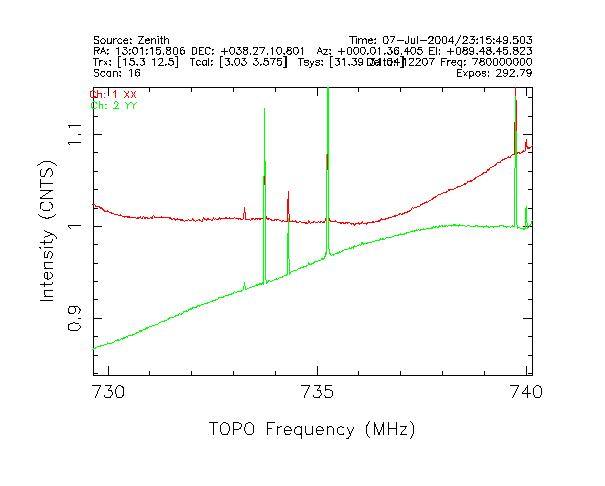
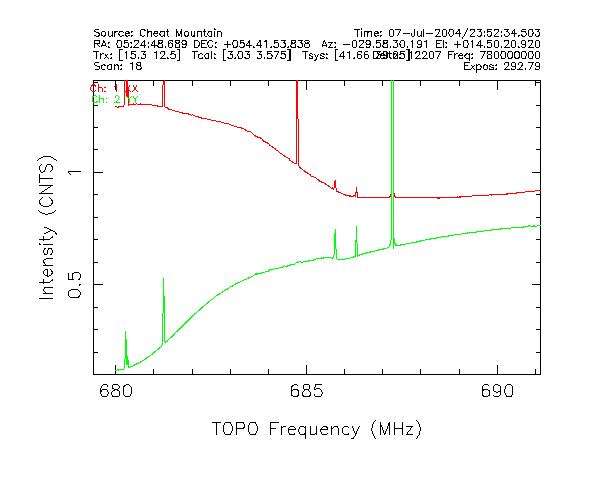
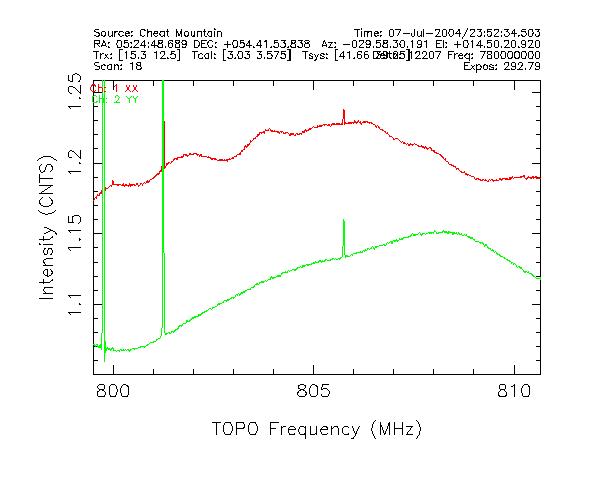
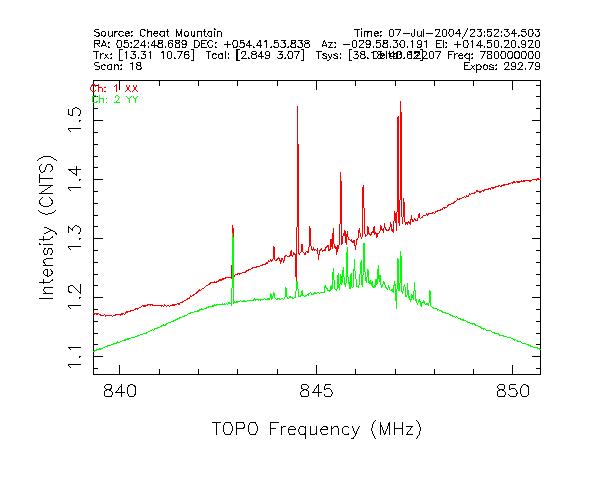
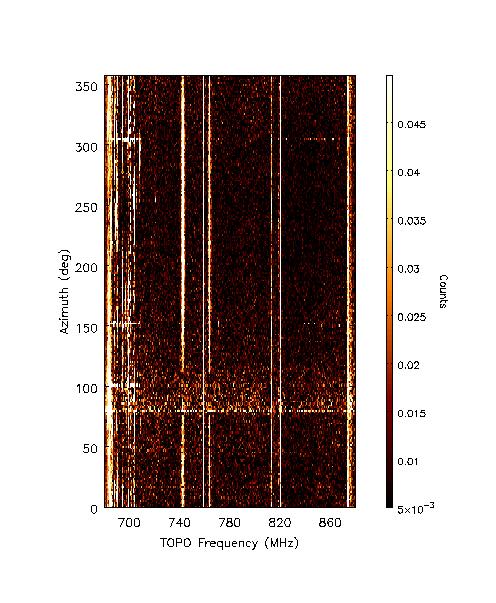
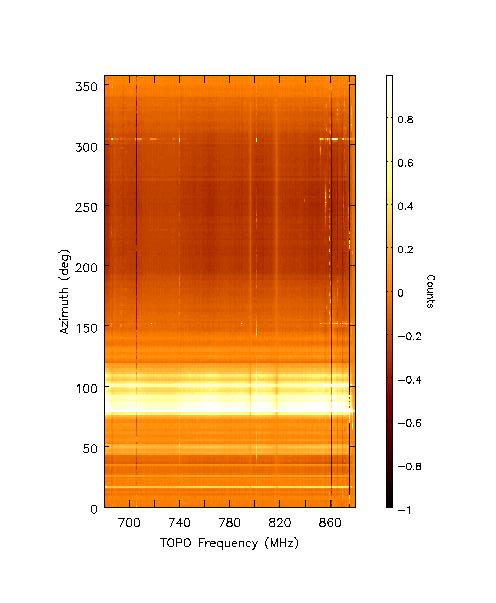
Figures 92 and 93 show the data for each
polarization where the first and last integrations (towards the North)
have been linearly interpolated in time and subtracted from the data.
These plots best show directions from which low-level, broad-band RFI
is orginating.
 |
 |
|
Figure 92 Click on image for postscript version.
X (left) and Y (right) polarizations. 200 MHz bandwidth centered on 780 MHz.
Data has had all emission from the North subtracted from the whole data set.
|
 |
 |
|
Figure 93 Click on image for postscript version.
X (left) and Y (right) polarizations. 200 MHz bandwidth centered on 820 MHz.
Data has had all emission from the North subtracted from the whole data set.
|
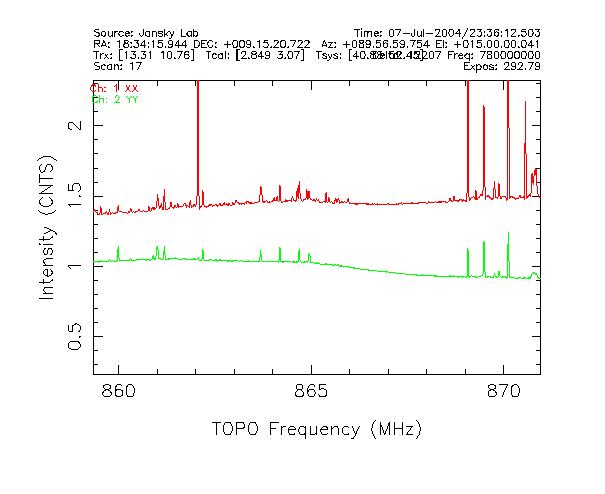
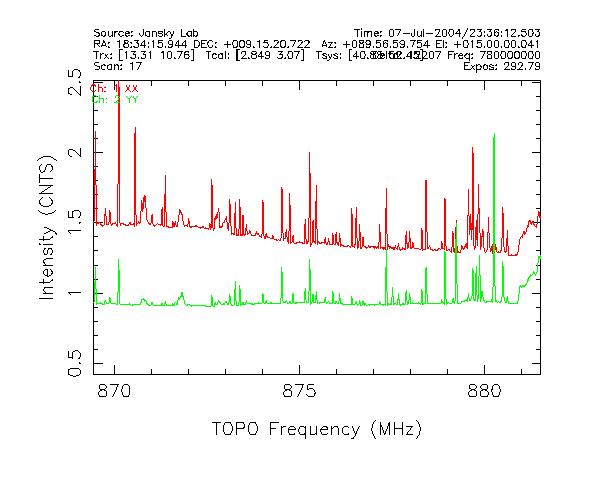
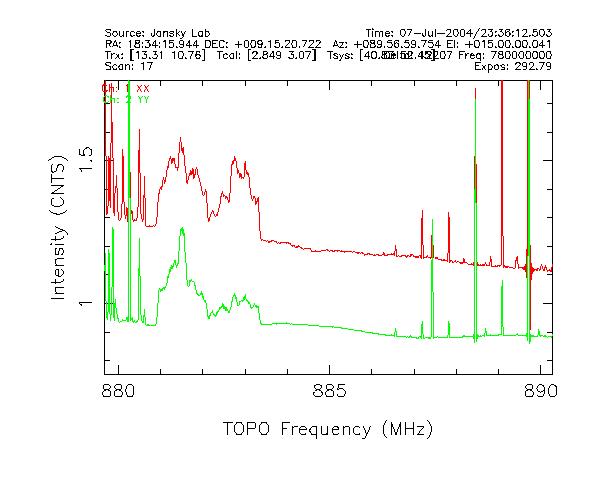
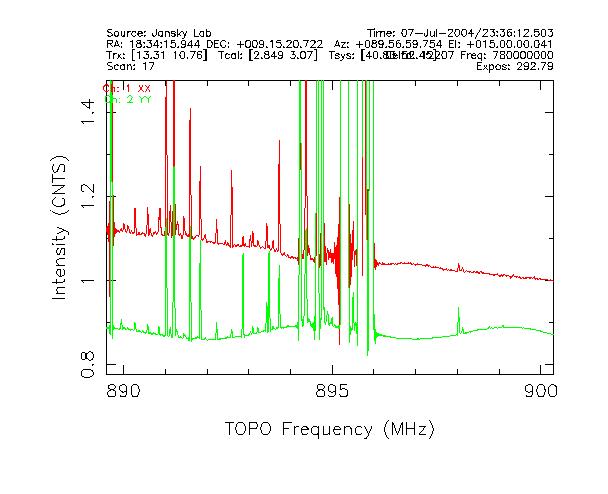
Summary
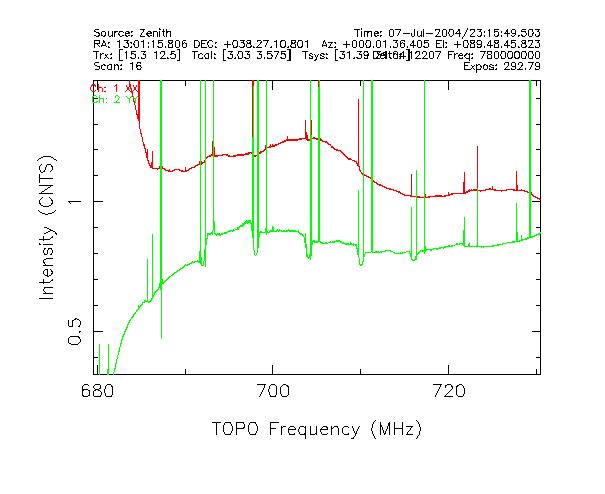
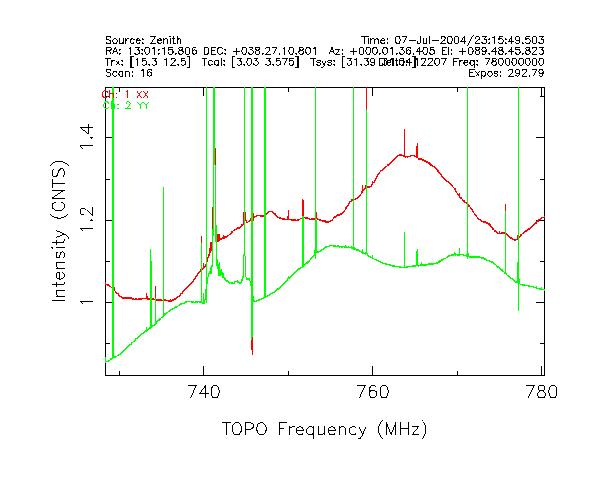
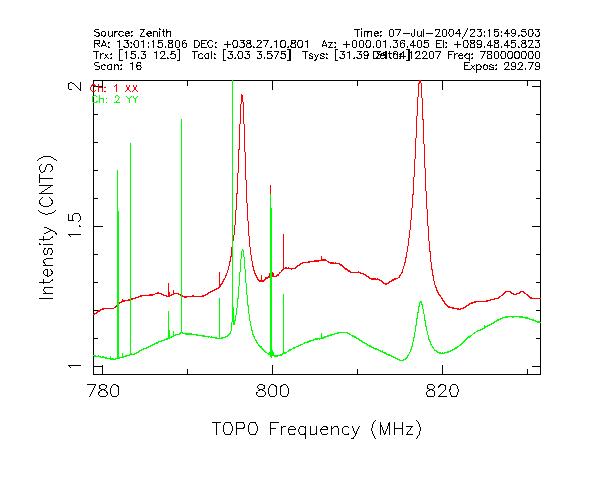
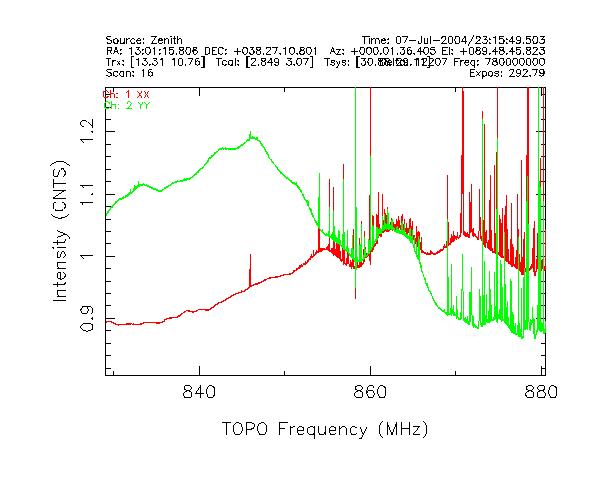
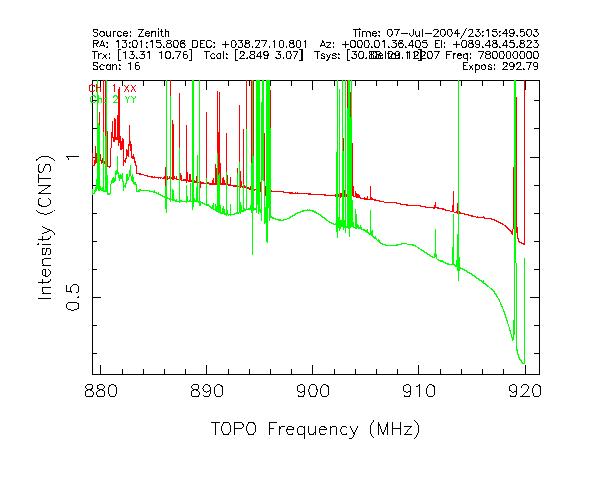
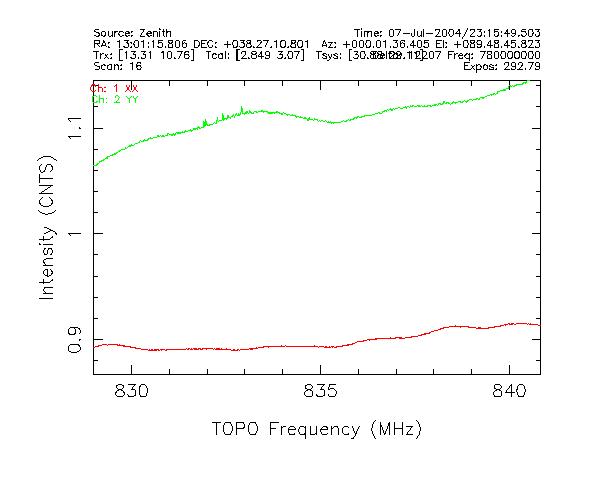
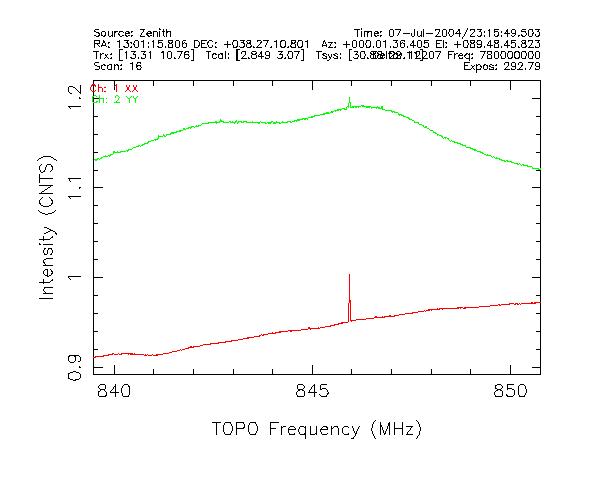
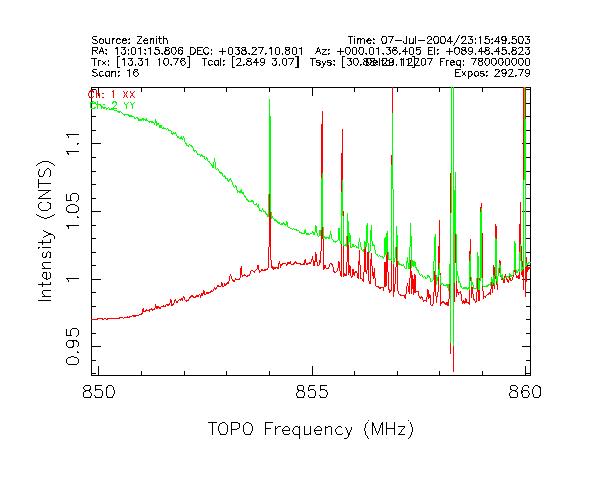
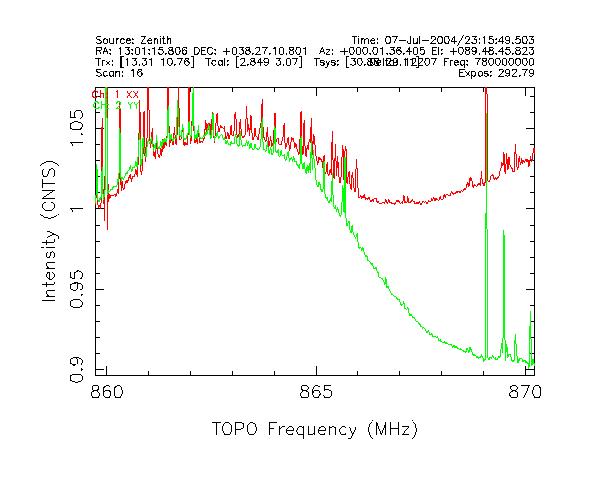
Many RFI frequencies exist in the PF1 800 MHz bandpass. The best area
for observations appears to be between 801 MHz and 850 MHz. RFI
definitely increases towards the Jansky Lab and the surrounding
residential areas.
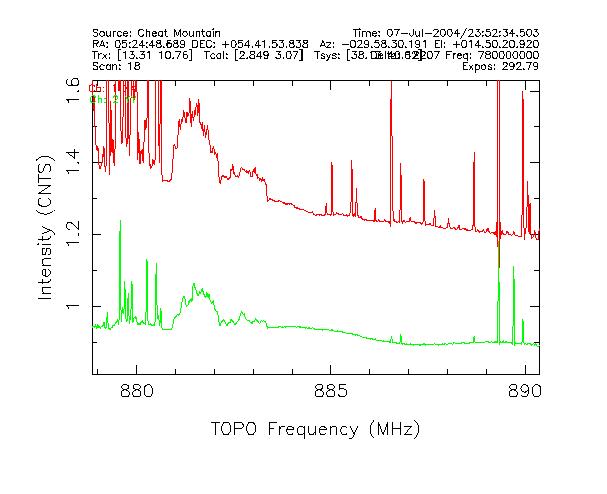
The vast majority of the RFI in this scan is due to UHF TV stations
(below 806 MHz), Airphones and cellular control towers in the 869-894 MHz
range.
These signals originate from outside the NRQZ. The favorable range of
801 MHz - 850 MHz is due primarily to the lack of cellular phone handsets
(824-849 MHz) and the non-use of a couple other allocations in this range
in the vicinity of the observatory. Note that a virtual absence of RFI in
the plots 49 - 51, which were taken with the GBT pointed in the direction
of the Jansky Lab, reinforces this theory. It is likely that the apparent
directionality in some of the plots is due to gaps in our terrain shielding.
Note that our horizon is actually below the horizontal in one direction and
close to the horizontal in a few others.
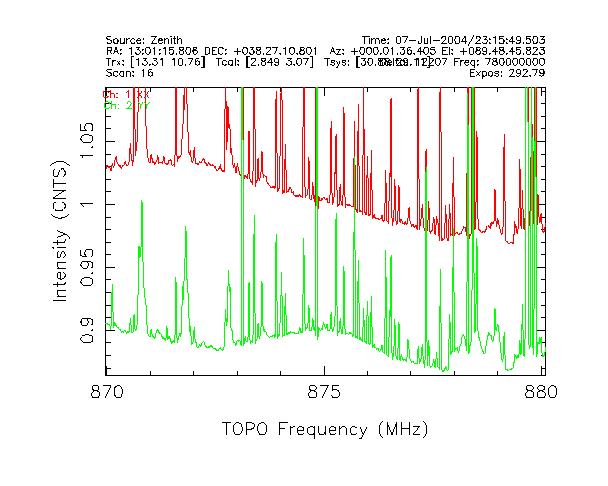
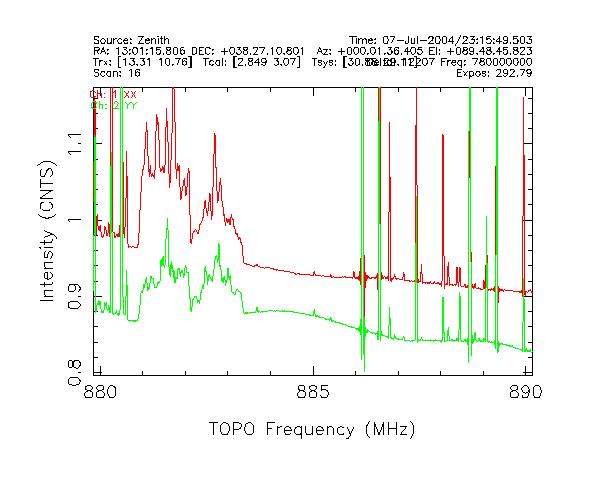
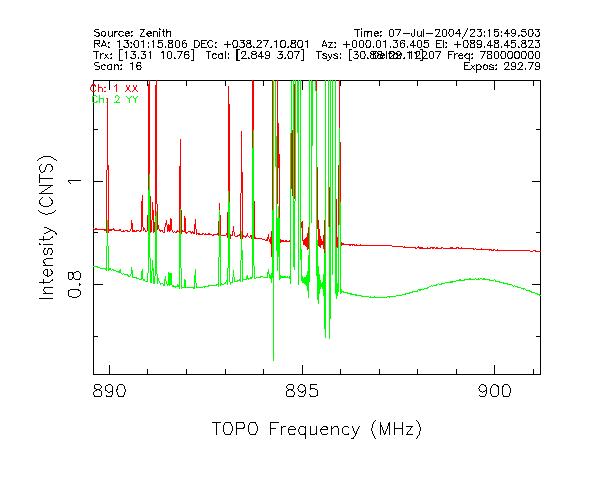
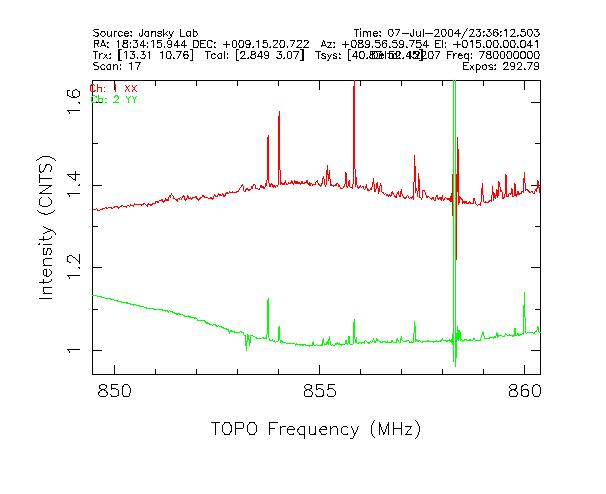
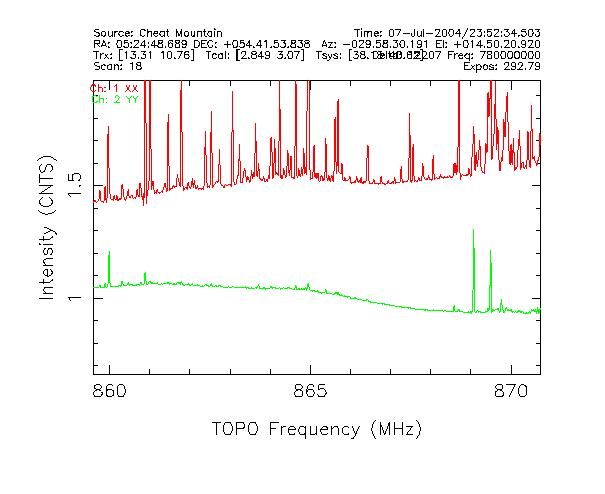
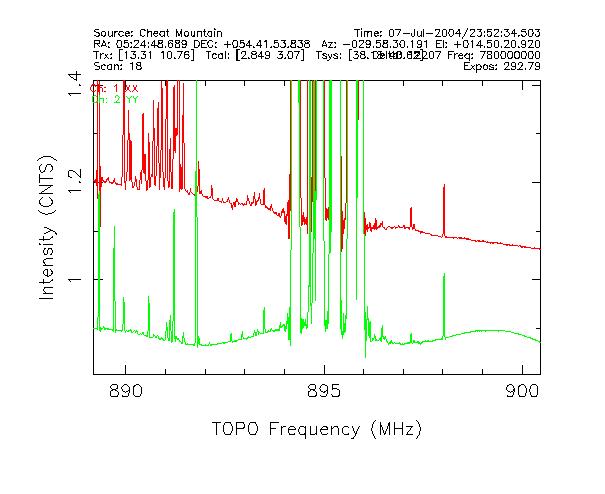
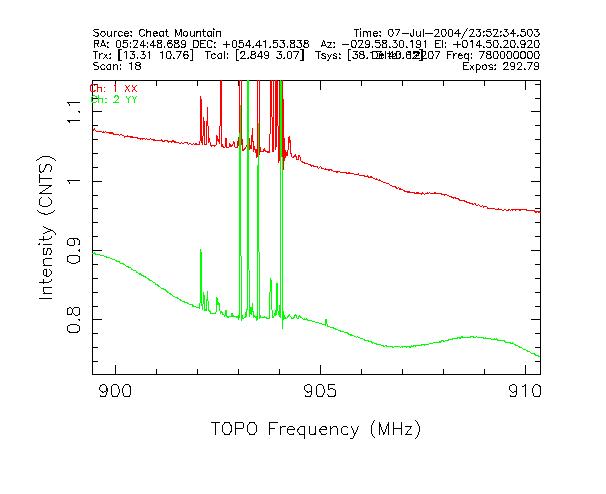
The Airphone RFI tends to dominate the RFI scene when present. It has
on occasion been 20 to 40 dB above the noise floor. The Airphone
allocations are in the range 894 to 896 MHz and can clearly be seen
in Figure 85.
Below is some additional detail about the allocation of the spectrum from
806 to 902 MHz:
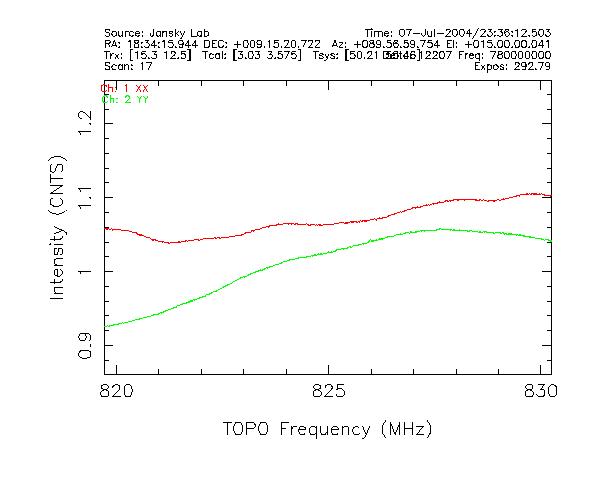
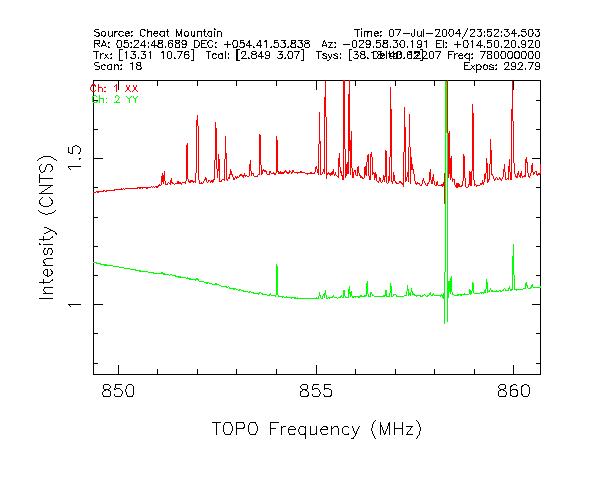
806-821 MHz - Non-government allocation for Fixed/Land Mobile transmitters. Used by SMR mobiles.
816-820 MHz - Non-government allocation for Basic Exchange Telephone Service. Paired with 861-865 MHz.
821-824 MHz - Non-government allocation for Land Mobile (Mobile-to-Base) transmitters. Used by Public Safety providers.
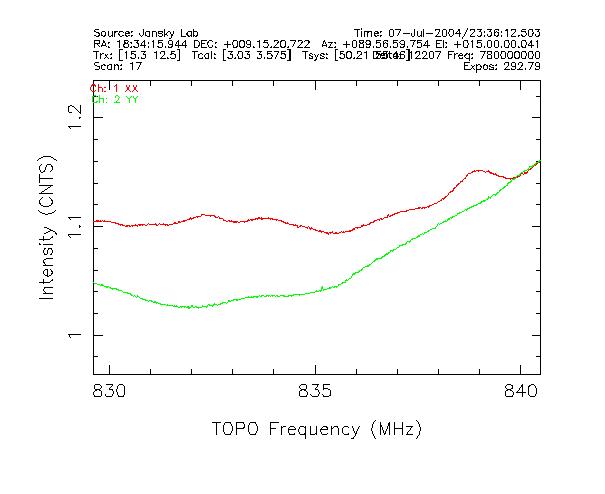
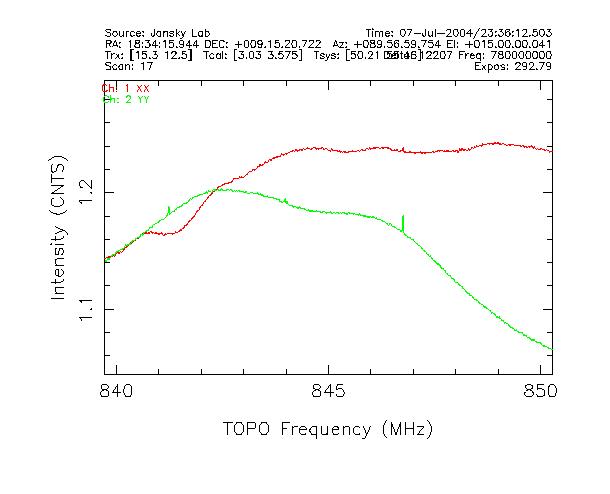
824-849 MHz - Non-government allocation for Fixed/Land Mobile transmitters. This is the band used by Cellular Mobiles.
849-851 MHz - Non-government allocation for Aeronautical Mobiles. This is one of two bands used by Airphones.
851-866 MHz - Non-government allocation for Land Mobile transmitters. This is the band used by SMR base stations.
866-869 MHz - Non-government allocation for Land Mobile (Base-to-Mobile) transmitters. Used by Public Safety providers.
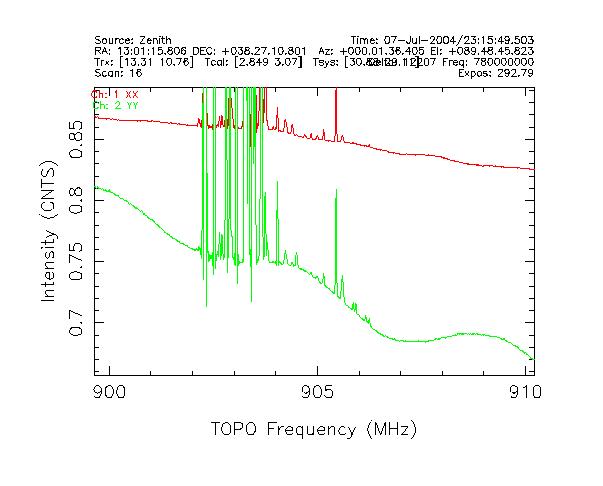
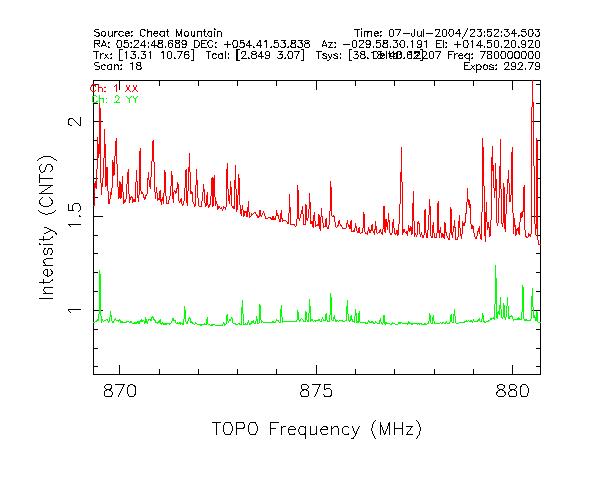
869-894 MHz - Non-government allocation for Fixed/Land Mobile transmitters. This is the band used by Cellular Base Station.
894-896 MHz - Non-government allocation for Aeronautical Mobiles. This is one of two bands used by Airphones.
896-901 MHz - Non-government allocation for Fixed/Land Mobile (Mobile-to-Base) transmitters.
901-902 MHz - Non-government allocation for Personal Communications (narrowband PCS) transmitters.