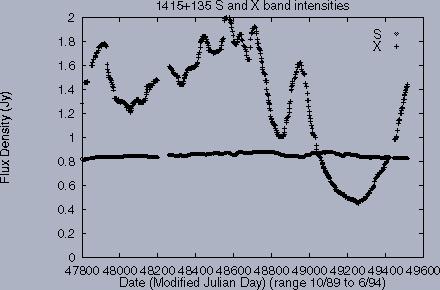
Plot of the X and S band flux densities of 1413+135 versus time.
The nearly constant line at 0.8 Jy is the S band Flux density, and the
variable line is the X band flux density. Note there is significant
variation with in a 3 month interval.
We present VLBI observations of the remarkably variable radio source
1413+135.
(See Figure 1).
We began our studies of 1413+135 to discover why is 1413+135 so
variable at high frequencies, yet nearly constant at low frequencies.
Answer: The compact core of 1413+135 is faint at lower frequencies,
while at higher frequencies the lobes are.
At frequencies lower than 3 GHz, the parsec scale jets of 1413+135
produce most of the emission.
The outer regions of the jets are not rapidly
variable in intensity, while the core is highly variable.
Recently obserservations of 1413+135 were make
using ISAS's VSOP satellite and NRAO's VLBA.
A schmatic diagram of the observing system is shown in Figure 2.
These observations utilized the NRAO Green Bank Tracking station
shown in Figure 3.
This page presents work towards progress to understand the region near
the central engine of these sources.
Figure 2: :Figure 3
Figure 2: Graphical representation of the VSOP Satellite co-observing with
Ground Antennas. The satellite receives a maser based reference
tone from the tracking station, and transmits the sampled astronomical
data to the tracking station for recording.
Figure 3: NRAO Green Bank Space VLBI Tracking Station. Designed by NRAO
for NASA to support the Japanese ISAS VSOP and Russian RadioAstron missions.
Figure 4:
Hubble Space Telescope Archive Image of the host galaxy containing 1413+135.
The HST image was taken with filter F555W and has
pixel size is 0.044 x 0.044 arc seconds.
Notice the "spiral" shape of the galaxy.
The vertical strip is a bad column on the HST Wide field Planetary Camera.
There is a dust lane running across the center of the galaxy.
This image has been processed with a 0.2 x 0.2 arc second
gaussian convolving function to show the galaxy more clearly.
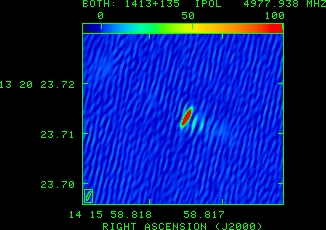
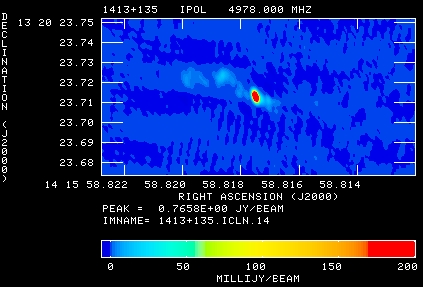
Figure 5: Image of 1413+135 at C band based only on the VLBA observations.
The peak flux density is 0.765 Jy/Beam for a synthesized beam
0.00361 x 0.00191 arc seconds with position angle 16.79 degrees.
The entire VLBI image of 1413+135 is approximately the size of
a single pixel of the HST image.
The image is available in
FITS format.
The radio source 1413+135 is remarkable for a number of reasons;
1) it is 18 times more variable at 3.6 cm (X band) wavelengths than
at 13 cm (S band),
2) it is one of the few (5) sources
where radio absorption lines of (Carilli et al. 1992),
CO, HCN and other molecules (Wiklind and Combes 1994) have
been detected in absorption, and
3) it appears to be a young radio source ( years,
Perlman et al. 1996).
Radio source 1413+135 is one of 5 sources in our sample.
The properties of these 5 sources are summarized in Table 1.
The radio source 1413+135 is compact, < 0.1 arc seconds in extent, and is
a VLA calibration source. The source was monitored daily by the
Green Bank Interferometer (GBI), between October 1989
and June 1994.
It was the remarkable GBI (Waltman et al. 1992, Figure 1)
data which brought our attention to this source.
Perlman et al. 1996 have published excellent images of 1413+135.
These images did not resolve the central component
of 1413+135, but did show the spectral properties of the outer regions
which explain the nearly constant brightness of the 1413+135 at lower
frequencies.
The high time variability of 1413+135 at X band, a 50 % increase
in 0.3 years, indicates it has components smaller than 0.08 pc.
This corresponds to an angular size of 35 milli-arc seconds,
assuming Hubble's Constant = 100 km/sec/Mpc and q_O = 0.5.
The optical host of 1413+135 appears to be a spiral galaxy, as
shown by the HST image in Figure 4. The VLBA image of 1413+135
at C band is shown in Figure 5. The VLBA plus VSOP image is shown
in Figure 6. The VLBA + VSOP data resolve the more extended ``lobe''
components, and show the jet components close to the core.
Perlman et al. 1996 find no evidence for motion of the components
of 1413+135 on scales larger than 2 mas.
Their measurements of the spectra of the jets, along
with limits on the temperature of the gas surrounding
1413+135, are consistent with a young or recurrent model for the source.
The VLBA image in figure 5 is approximately the size of one pixel of the
HST image in Figure 4.
The VSOP+VLBA image has approximately 3 times the
resolution of the VLBA only image, as expected. The more extended
components of 1413+135 visible in the VLBA only image are resolved
out in the VSOP image.
Still higher resolution and more frequent observations of 1413+135 are
needed to explain the high core variability.
Planed future Space VLBI missions will provide sufficient sensitivity
and resolution to resolve the core of 1413+135.
GBI monitoring of 1413+135 has resumed, and the data suggest that
1413+135 appears to have begun a quiescent period.
Figure 6: HALCA plus VLBA image of 1413+135 at C band.
Notice the two components of the jet visible to the south west, which
are not resolved in the VLBA only image.
The synthesized beam for this image is 0.00205 x 0.00047 arc seconds
with position angle -26.31 degrees.
The entire image above is smaller than a single pixel
of the HST image.
The image is available in
FITS format.
The Space VLBI image has a factor of 3 angular resolution over the
ground based image, as expected. The ground based image shows the
more extended jet emission to the north east. This emission is barely
visible in the Space VLBI image, which is more sensative to the
compact emission near the core of 1413+135.
Sources in High Frequency Variable Sample
The table 1, below, lists the radio sources which are part of the
High Frequency Variable sample from the Green Bank Interferometer
monitoring experiment.


 :Figure 3
 : Figure 5