A Guide for Planning Observations
GBT Science Support Staff
December 21, 2005
Revised: November 1, 2009
Cosmetic Revisions Only: November 28, 2017, January 26, 2021, June 15, 2021
Observers need information about the weather conditions, atmospheric opacities, and receiver and telescope performance to best plan out their observations with the GBT. Here I hope to present some of the material an observer will need to write the technical section of a GBT proposal and, to plan observations.This page is divided into the following sections:
- Telescope Efficiencies
- Green Bank Weather
- Typical Weather Conditions when using Dynamic Scheduling
- Total System Temperatures
Other useful planning information can be found at:
- GBT Sensitivity Calculator
- GBT Mapping Calculator
- GBT Proposal Guide
- GBT Observing Guide
- Practical Information For Astronomers
Telescope Efficiencies
The conversion from detected antenna temperature (TA) to source flux (S) is usually given as:

where η is the telescope's efficiency, which depends upon your observing frequency and the angular extent of the observed source, k = Boltzman's constant, and A is the projected area of the dish of the telescope (7854.0 m^2). We will discuss below how to estimate the opacity.
For point sources, one should use aperture efficiencies whose frequency dependence is given by Figure 1 (Revised Nov 1, 2009). The curve in Figure 1 was determined from measured efficiences below 50 GHz which implies a surface accuracy of 220 microns which then allows one to use the Ruze equation to extrapolate efficiencies to 116 GHz.
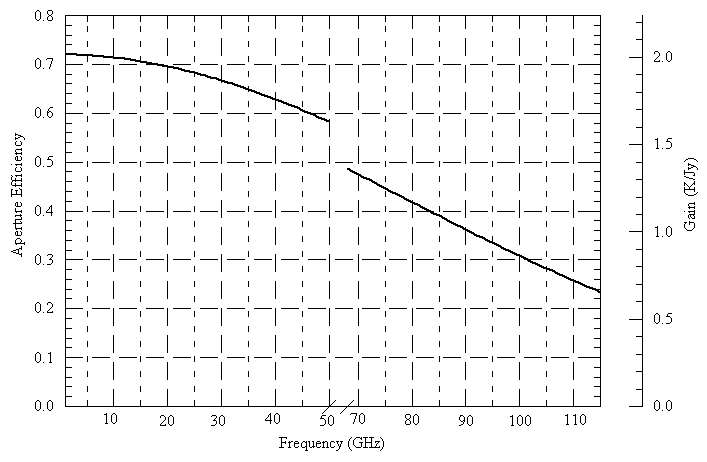
Figure 1: Aperture efficiency
For sources whose size fills the beam to the first null of the response pattern, many observers prefer using beam efficiency. For the GBT, beam efficiency is approximately 1.32 x aperture efficiency.
For sources that are extended more or less than this, see any general text on radio astronomy (e.g., Baars (1973), "The measurement of large antennas with cosmic radio sources" or Chapters 5 and 6 of Rohlfs & Wilson's (2006) "Tools of Radio Astronomy".
When observing at high frequencies, the telescope's active surface corrects for large-scale surface deformations as a function of elevation. These corrections produce relatively flat elevation gain curves, at least down to elevations of 20 degrees. See https://safe.nrao.edu/wiki/bin/view/GB/PTCS/ActiveSurface for more information about the active surface. Contact a support staff member for updated efficiency values if you are planning on observing above 40 GHz and at low elevation.
These efficiencies are for planning purposes only and observers should not use them for anything but a rough calibration of their data. Please discuss with the support staff how best to determine the calibration for your particular experiment .
Green Bank Weather
The weather affects observations in three ways: winds affect the telescope pointing, differential heating/cooling affect the telescope pointing and efficiency, and atmospheric opacity affect the received signal and the system temperature.
Time of Day and Differential Heating and Cooling
Differential heating and cooling of the telescope alters the surface of the telescope, resulting in degradation of telescope efficiencies, and 'bends' the telescope, resulting in pointing changes. At high frequencies, these affects are important. The current recommendations are that, for best work, observing above 40 GHz should only be done at night, from 3 hours after sunset to 2 hours after sunrise. As the Precision Telescope Control System (PTCS) project develops, we can expect that the recommendations against daytime, high-frequency observing will be relaxed somewhat.
Low frequency observers may want to consider night time observing for two reasons. RFI is usually lower at night; and, in some cases, the sun has a slight negative impact on baseline shapes.By default, we assume that daytime observing will be acceptable for all observations below 26 GHz. and that all observations above 26 GHz will occur at night. Observers with proposals below 26 GHz must provide full justification in their proposals if they require nighttime observing.
The following graph depicts the range of UT, EST, and LST for our definition of 'night-time' observing.
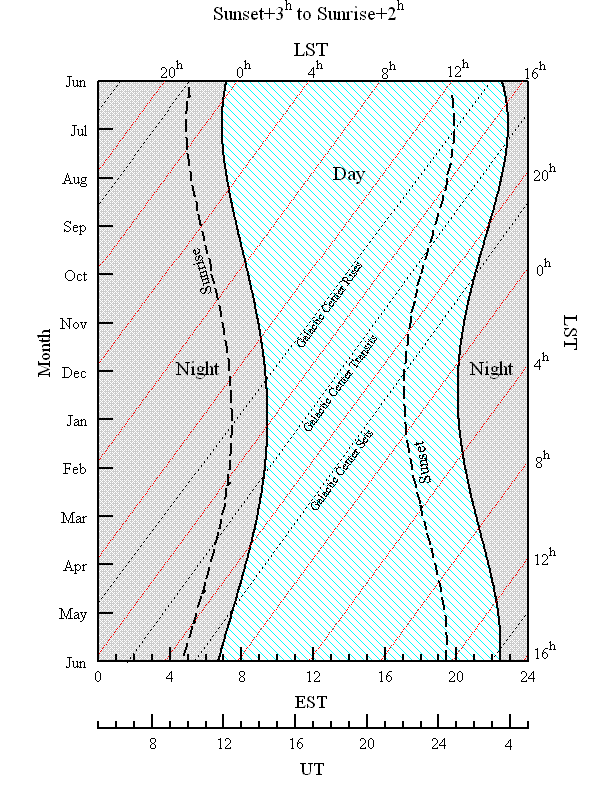
Figure 2: Sunrise and Sunset
For example, if you would like to observer the Galactic Center at night and within 2 hours of transit, then you should propose for the trimesters that span March 15 through June 15.
Winds
Winds tend to buffet the telescope and, to a lesser extent, set the feed arm into motion. The current recommendations for wind limits can be found at: https://safe.nrao.edu/wiki/bin/view/GB/PTCS/PointingFocusGeneralStrategy. Winds don't usually enter into the planning of one's observations and the statistics presented here are included solely for informational purposes.
The fraction of time when wind speeds are low is illustrated in the above figure which shows the cumulative percentages when wind speeds are below a certain value. The data were for October 1, 2004 to April 30, 2005.
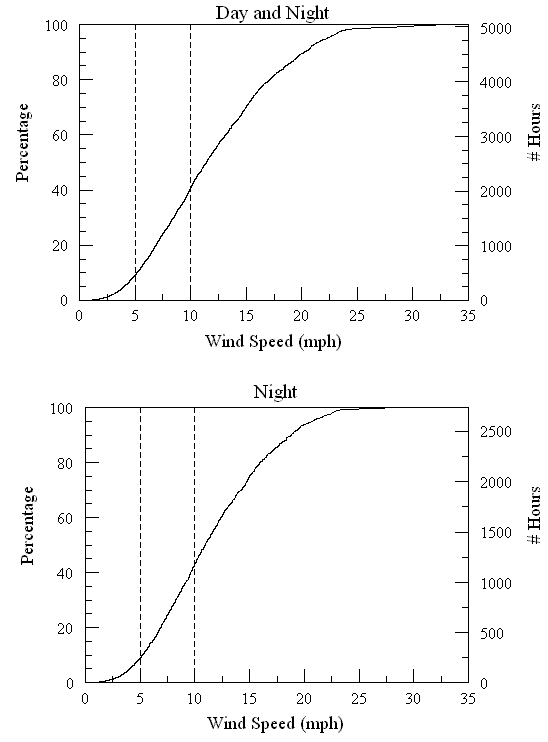
Figure 3: Wind Statistics
Since each year the weather trends can be different, these statistics shouldn't be too widely quoted. Note that there's very little difference between day and night time wind statistics.
Atmospheric Opacities
The frequency range covered by the GBT extends from low frequencies where the opacity is relatively low (~0.008 nepers) to high frequencies where opacity is very high (> 1 nepers). Atmospheric opacity hits observing twice -- it attenuates the astronomical signal and it increases the system temperature, and the noise in the observation, due to atmospheric emission.
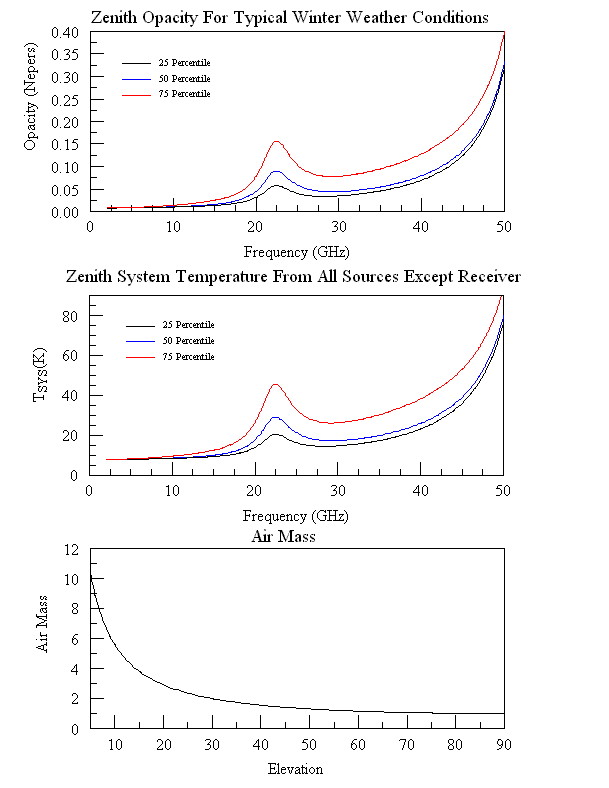
Figure 4: Typical Opacities, Zenith System Temperatures, and Air Mass
The first panel in the above figure shows opacities under three typical weather conditions as calculated using the method described on our "High Frequency Weather Forecasts" web page. (You may want to look at this web page for a discussion and references on opacities at the radio frequencies.) The black, blue, and red curves represent the opacity under the best 25, 50, and 75 percentile weather conditions. That is, the 'average' opacity over the winter months is best described by the 50 percentile graph.
The second panel is an estimate of the contribution to the system temperature at the zenith from the atmosphere, spillover, and cosmic microwave background. That is, everything but the telescope's receivers. I will show system temperatures that include the receiver in the next section followed by plots on how system temperature increase when one observes away from the zenith.
Observers will need to know which of the above opacity or system temperature curves they should use when planning their observations. That will be answered in the next section.
The third panel depicts the number of air masses the astronomical signal must pass through as a function of elevation. (The curve is a better approximation than the csc(elevation) approximation that is only correct above about 20 degrees elevation.)
One should use the opacities from the first panel and the air mass from the third panel to approximate the amount of attenuation a signal will experience at the expected elevation of the observation. The signal is attenuated by:
![]()
These opacities are for planning purposes only and observers should not use them at high frequencies for calibrating data. Since opacity is very weather dependent, please consult with a local support staff on how best to determine opacities for your observing run. One can use these opacities only at the lowest frequencies.
Typical Weather Conditions when using Dynamic Scheduling
Our current implementation of Dynamic Scheduling is in place only for the cold, dry months of October through April. In our implementation, winter high-frequency observers have double the chance of observing under 'good' weather.
For scheduling purposes, by default we assign the designation of 'high frequency' to any observation above 10 GHz. Weather can influence continuum or wide spectral-line observations observations at or below 10 GHz,. Observers who will be observing below 10 GHz but require good weather conditions should clearly justify this requirement in their proposals.
High frequency observers can expect to be observing with opacities that are at or below the average (50 percentile) winter conditions for Green Bank. Thus, high frequency observers can anticipate that the typical weather conditions under which they will observe will be best represented by the top 25% percentile conditions. In contrast, low-frequency, winter observers should expect they will observe under conditions that are worse than the 50 percentile and more like those of the 75 percentile conditions.
During the warm season (June through September), high-frequency observing is much less productive and we almost exclusively schedule low frequency observing. During these months, low frequency observers can plan on observing under the average, 50 percentile conditions.
In summary, to plan your observations, use the percentile graphs suggested by the following table for your observing frequencies and time of year :
| Weather Percentiles | |
|---|---|
| High Frequency - Winter | 25% |
| Low Frequency - Winter | 75% |
| Low Frequency - Summer | 50% |
Total System Temperatures
In order to estimate the noise in an observation, one needs to know the system temperature for the observed frequency and elevation. For planning purposes, one can assume the atmospheric conditions described in the sections on dynamic scheduling and 'typical' opacities. The actual system temperatures during an observation may be different from those presented here.
Zenith System Temperatures as a Function of Frequency
To derive the system temperature as a function of frequency, one adds the receiver temperature to that for the atmosphere, spillover, etc. that is given in the plot above. Note that receivers do not have the same performance across their bands, nor does every receiver have the same receiver temperature.
Opacity is essentially weather independent for low frequencies. The following figure provides the expected system temperature at the zenith for these receivers.
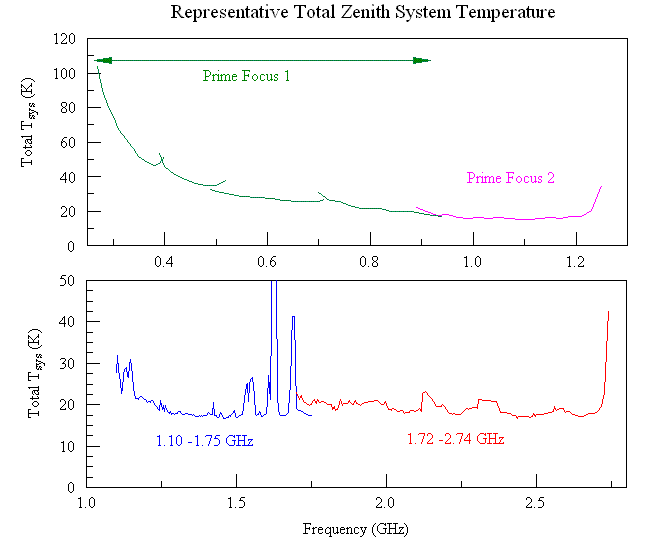
Figure 5: System Temperatures for Low Frequencies for Typical Weather Conditions
Note that these graphs include an estimate of the galactic background emission for galactic latitudes greater than 45 degrees. At lower latitudes, system temperatures can be significantly higher.
For high frequency receivers, opacity is weather dependent and one should plan on having a system temperature using the rules discussed in the section on dynamic scheduling. The zenith system temperatures for typical weather conditions are:
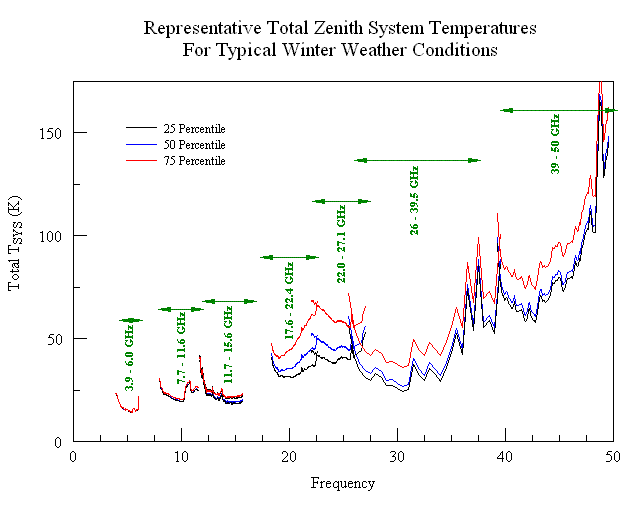
Figure 6: System Temperatures for High Frequencies for Typical Weather Conditions
System Temperatures as a Function of Elevation for Selected Frequencies
Since little observing happens at the zenith, observers also need to know how system temperatures increase when observing away from the zenith. The following figures give the elevation dependence on system temperature for selected frequencies under typical weather conditions.
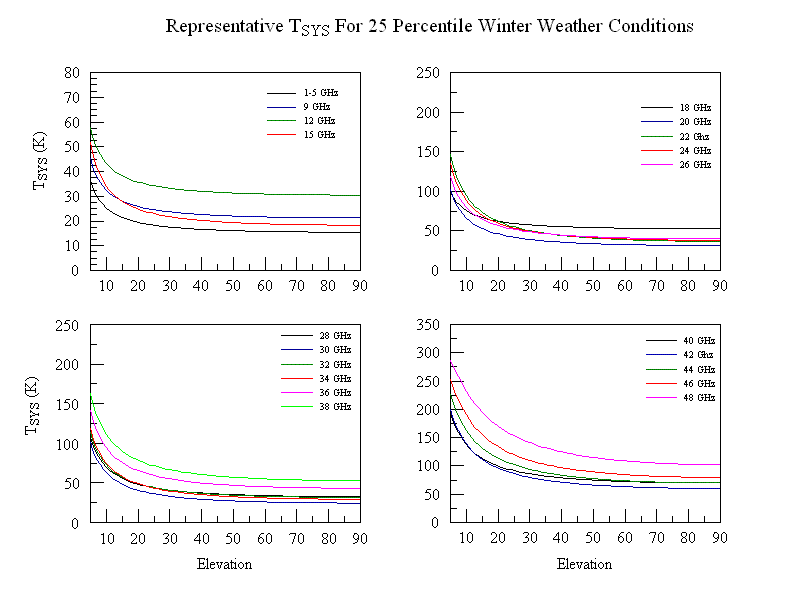
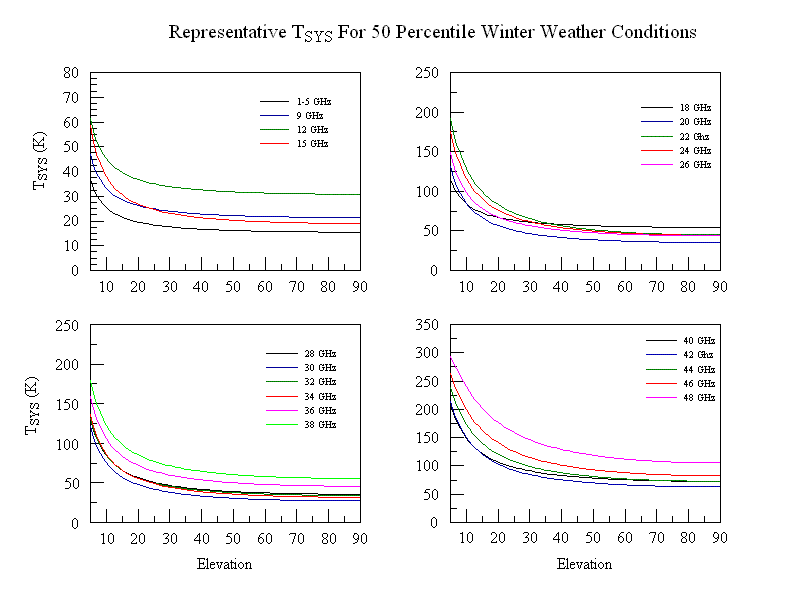
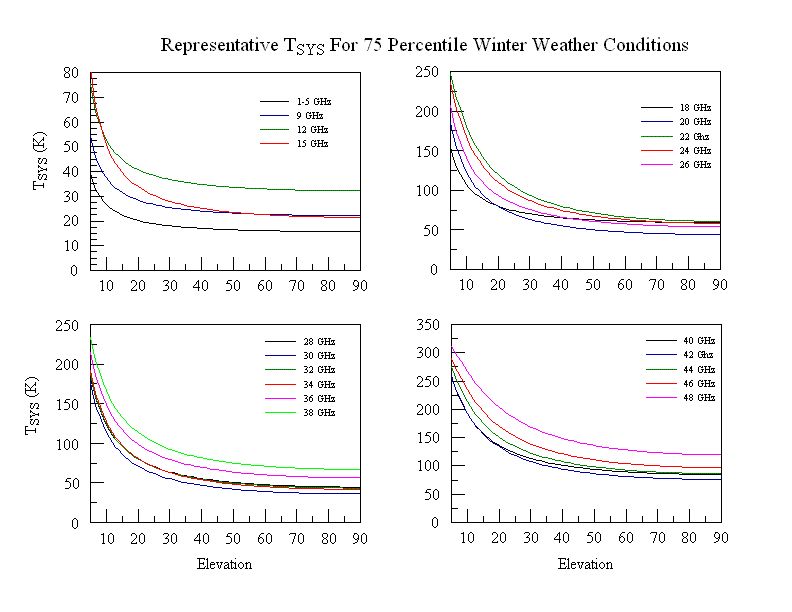
Figures 7-9: System Temperatures as a Function of Elevation and Frequency for Typical Weather Conditions
