VLBA Observations of PKS1413+135
Model fitting
Elliptical gaussian component models were fit in the UV plane
using "difmap". In all cases, components were fit at the positions
of the main peaks and structures in the maps, trying to account for
all or most of the flux. The typical RMS in the residual maps after
the model fits was 0.2 to 0.3 mJy/beam.
Details of the model fits are given:
Explanation of model fitting.
Models at C band
Models at X band
Models at U band
Model fitting in the western jet at U-band
In the U-band maps (15 GHz) the western jet shows prominently, and the
features seen in the eastern jet, apparent at 5 and 8.4 GHz, are much
weaker or missing.
To study motions of features in the western jet we used two 15 GHz VLBA
observations in addition to the three sessions mentioned above:
1) a map from January 4, 2001, kindly provided by Kellermann
(private communication), 2) an observation on January 22, 2001 from the
15 GHz AGN monitoring program (Kellermann et al 2004).
Table 1 shows details of these maps.
Table 1: PKS1413+135 15 GHz observations.
| Date (2001) | Reference | Antennas
| Beam at 15 GHz (mas)
|
| Jan 04 | Kellermann et al | 10 + VLA
| 1.17x0.57 at -7.9°
|
| Jan 22 | AGN Survey | 10
| 1.20x0.50 at -13.5°
|
| Feb 28 | This paper | 10
| 0.99x0.45 at -7.2°
|
| Apr 01 | This paper | 9 *
| 1.15x0.55 at -3.6°
|
| Apr 30 | This paper | 9 *
| 1.73x0.54 at -19.4°
|
Because of differences in the array configuration, the size of the
"clean" beam using "natural" weighting differs, as shown in column 4
of Table 1. But note that the smaller diameter of the beam, about 0.5 mas,
in all cases lies approximately along the axis of the jet. Hence
resolution of jet features in the radial direction from the core is
0.5 to 0.6 mas.
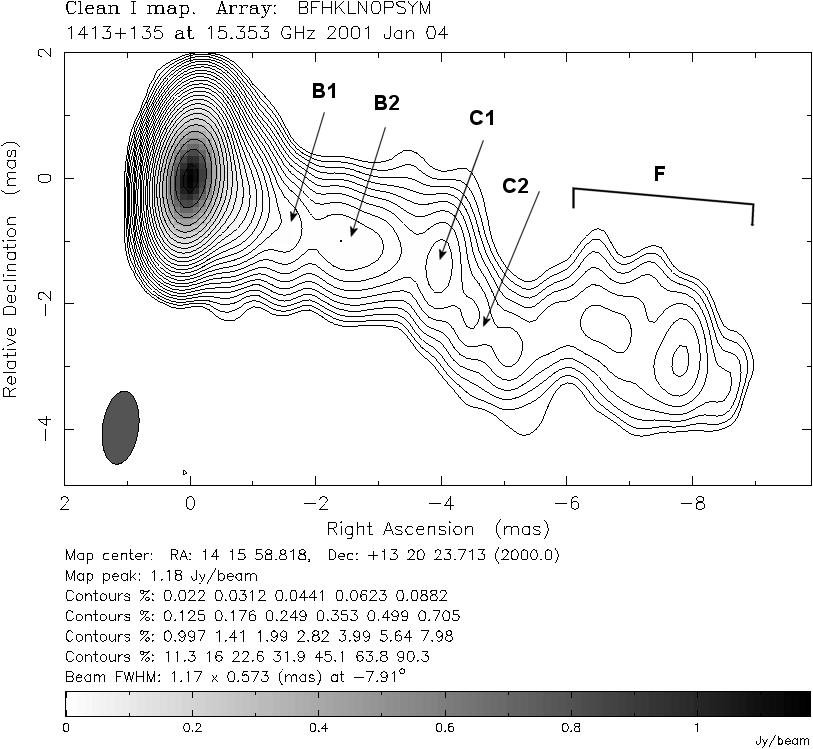
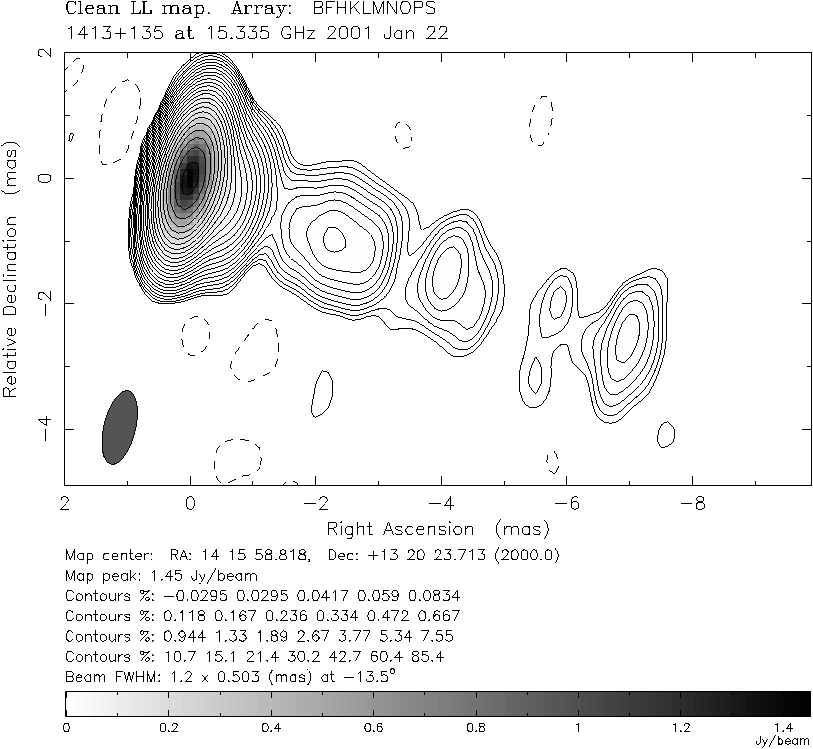
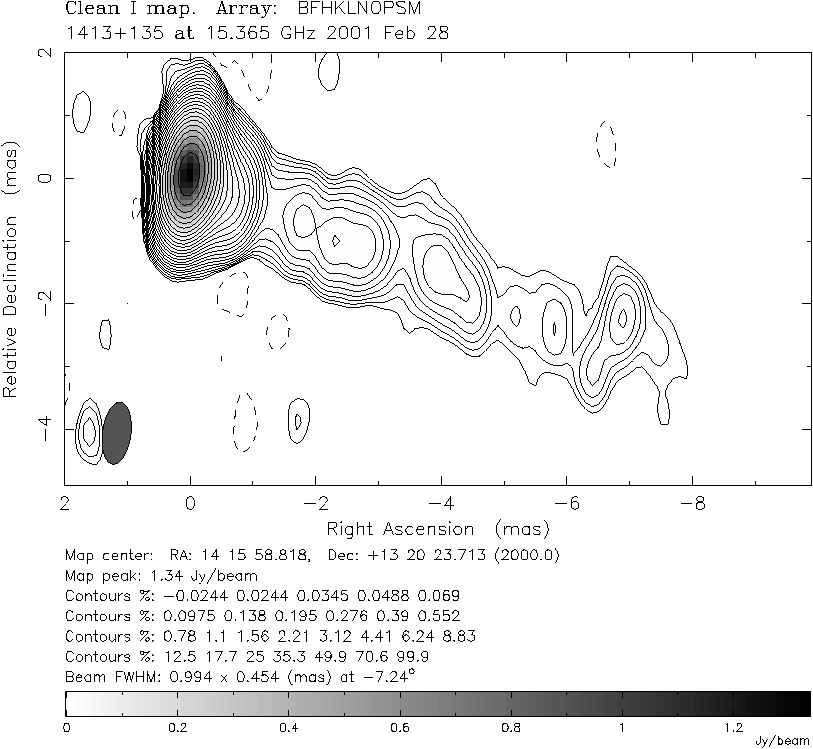
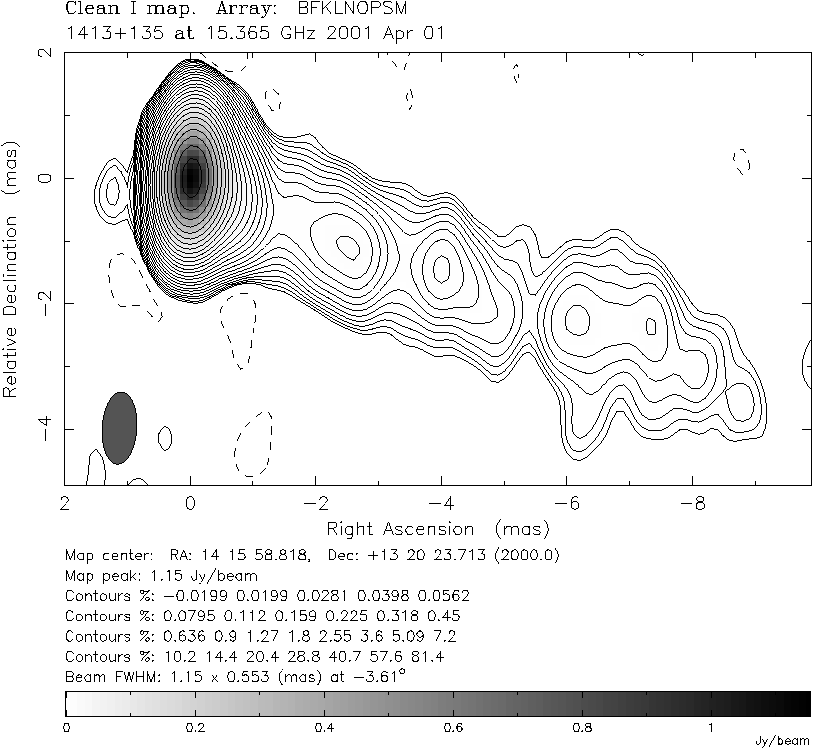
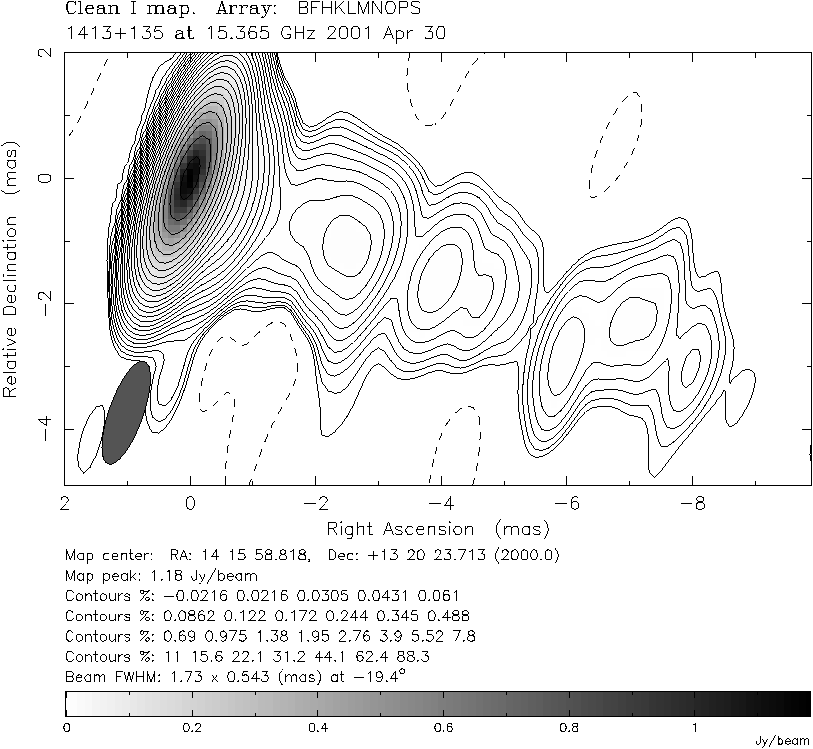
The maps at the five epochs are displayed in Figure 1 a-e. These were
cleaned using the "difmap" program with the "deepclean" algorithm of
Homan and Moellenbrock.
"BCF" Models
Following the convention used in Kellermann et al (2004), we refer to
the main components in the western jet as "B", "C", and "F".
Each of these components may consist of two or more subcomponents.
Thus we refer to "B1", "B2", "C1", and "C2" as the subcomponents of
"B" and "C". There did not seem to be a consistent identification
of subcomponents of "F" for the 5 epochs, so we have just modelled
this region as a single component.
Figure 1a shows the names of the components.
Figure 1A: Jan 04, 2001
|
Figure 1B: Jan 22, 2001
|
Figure 1C: Feb 28, 2001
|
Figure 1D: Apr 01, 2001
|
Figure 1E: Apr 30, 2001
|
Gaussian models were fit to jet features in the UV plane using the
program "difmap". We first fit elliptical gaussian models to
"B", "C", and "F", which will be referred to as the "BCF" models.
A second set of models in which circular gaussian components are
fit to "B1", "B2", "C1", "C2", and an elliptical gaussian to "F",
will be referred to as the "B2C2F" models.
Errors in the component positions are often estimated as the ratio
of the major axis of the component to the signal-to-noise.
From the discussion by Fomalont (1999) we estimate the position error
ΔL as follows:
ΔL = ΔR W/2P
ΔR is the rms error (mJy/beam) which we take to be
the rms of the pixels in the residual image after the fitted components
have been removed.
W is the major axis of the fitted component (mas),
and P is the peak intensity of the component (mJy/beam).
The location L is the radial distance of the component from the
core.
The resulting position errors (ΔL) often are less than 0.1 mas
for the brighter components. Given the clean beam minor diameter of 0.5 mas,
it seems reasonable to impose a minimum position error of 0.1 mas.
So 0.1 mas has been added in quadrature to all error estimates from the
previous equation.
Table 2 shows results for the "BCF" models,
and Table 3 for models "B2C2F" models.
Table 2. Models for components B, C, F.
| Component | | Jan 04 | Jan 22
| Feb 28 | Apr 01 | Apr 30
|
| B
| L (mas)
ΔL (mas)
W (mas)
Peak (mJy/beam)
Flux (mJy)
| 1.85
0.11
2.60
7.9
30.2
| 2.46
0.11
1.99
6.7
23.2
| 2.41
0.11
2.06
5.2
23.7
| 2.38
0.11
2.36
6.8
27.5
| 2.49
0.11
2.03
6.7
23.9
|
| C
| L (mas)
ΔL (mas)
W (mas)
Peak (mJy/beam)
Flux (mJy)
| 4.46
0.18
2.90
2.5
10.1
| 4.64
0.22
1.95
1.7
6.3
| 4.40
0.14
1.98
2.9
7.5
| 4.42
0.12
1.82
3.4
6.4
| 4.60
0.14
1.54
2.1
5.2
|
| F
| L (mas)
ΔL (mas)
W (mas)
Peak (mJy/beam)
Flux (mJy)
| 7.53
0.23
2.56
1.6
11.6
| 7.37
0.15
1.71
2.7
9.4
| 7.23
0.19
2.27
2.0
10.7
| 7.32
0.20
2.99
1.8
14.2
| 7.40
0.22
2.97
1.9
12.4
|
| | ΔR (mJy/beam)
| 0.258 | 0.341 | 0.278 | 0.213 | 0.256
|
Table 3. Models for components B1, B2, C1, C2, & F.
| Component | | Jan 04 | Jan 22
| Feb 28 | Apr 01 | Apr 30
|
| B1
| L (mas)
ΔL (mas)
W (mas)
Peak (mJy/beam)
Flux (mJy)
| 1.67
0.10
0.95
7.3
9.0
| 2.30
0.10
1.04
7.4
13.9
| 1.92
0.10
0.96
4.8
9.8
| 1.88
0.10
1.22
5.1
13.2
| 1.95
0.11
1.29
5.1
10.0
|
| B2
| L (mas)
ΔL (mas)
W (mas)
Peak (mJy/beam)
Flux (mJy)
| 2.71
0.10
1.16
6.0
13.0
| 3.10
0.10
0.93
5.8
7.3
| 2.91
0.10
0.99
5.4
12.7
| 2.97
0.10
0.99
7.3
11.2
| 2.90
0.10
1.22
7.1
12.7
|
| C1
| L (mas)
ΔL (mas)
W (mas)
Peak (mJy/beam)
Flux (mJy)
| 4.27
0.11
1.04
3.7
6.2
| 4.30
0.11
0.91
3.1
4.4
| 4.24
0.11
1.03
2.8
6.2
| 4.28
0.10
1.00
4.1
6.7
| 4.30
0.11
1.13
2.9
4.4
|
| C2
| L (mas)
ΔL (mas)
W (mas)
Peak (mJy/beam)
Flux (mJy)
| 5.08
0.11
0.82
2.5
2.5
| 5.12
0.14
0.87
1.9
1.9
| 5.03
0.11
0.67
1.6
1.6
| 5.30
0.11
0.85
1.5
1.5
| 5.09
0.12
0.67
1.5
1.5
|
| F
| L (mas)
ΔL (mas)
W (mas)
Peak (mJy/beam)
Flux (mJy)
| 7.45
0.20
2.60
2.0
12.6
| 7.28
0.16
1.71
2.4
9.8
| 7.10
0.25
2.54
1.6
12.4
| 7.33
0.22
3.00
1.7
14.3
| 7.34
0.23
3.13
1.9
13.1
|
| | ΔR (mJy/beam)
| 0.260 | 0.348 | 0.282 | 0.219 | 0.253
|
Taking the component positions of Table 2, we plot the positions
as function of time in Figure 2.
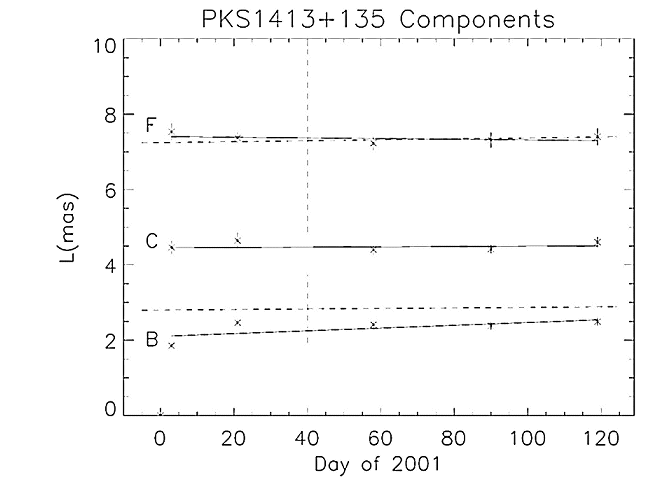
The x-axis is days from Jan 1, 2001. The lines show linear least-squares
fits for speed of each component.
The parameters of these fits are given in Table 4.
Table 4. Fits for component motion.
| Component | Speed in mas/year | Error (mas/year)
|
| B | 1.34 | 0.41
|
| C | 0.15 | 0.61
|
| F | -0.32 | 0.79
|
The component positions from Table 3 are plotted in Figure 3.
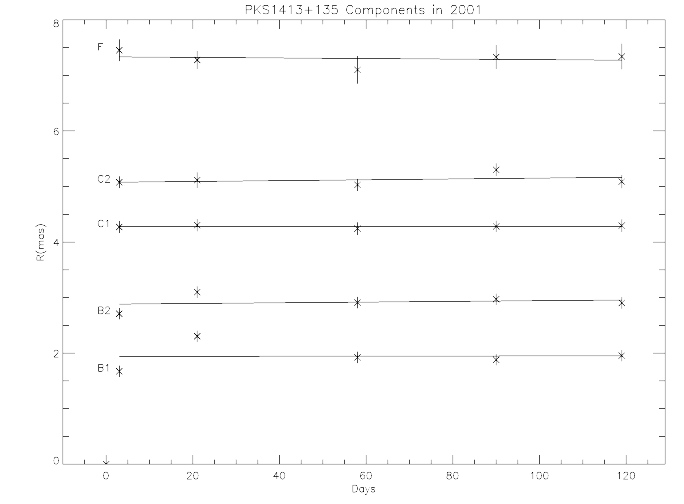
The fit parameters are given in Table 5.
Table 5. Fits for component motion.
| Component | Speed in mas/year | Error (mas/year)
|
| B1 | 0.03 | 0.39 |
| B2 | 0.23 | 0.39 |
| C1 | 0.02 | 0.42 |
| C2 | 0.28 | 0.44 |
| F | -0.18 | 0.79 |
Discussion of component motions
Most of the component speeds are consistent with zero motion, within
the errors of the least squares fits. The exception is the result
for "B" (Table 4), which shows a non-zero speed of 1.34 mas/year at
about 3 sigma significance. But this result is entirely due to the
influence of the first epoch (Jan 04), hence cannot be given much
significance. A speed of 1.34 mas/year would correspond to an apparent velocity
of ~20c, assuming H0=70 km/s/MPc, Ωm = 0.3, Ω&Lambda = 0.7.
The data from Kellermann et al (2004) for PKS1413+135 observed over a
6 year span, shows speeds for the components as 0.25 mas/year for B,
0.37 mas/y for C, and 0.45 mas/y for F. Our results are consistent with
their speeds. On Figure 2, we show the position of components B and F
predicted by Kellermann et al (2004) as horizontal dashed lines.
The one-sigma errors are indicated by the vertical dashed lines.
One can see that our measurements agree with those of Kellermann et al
within the errors. The speed of component F is indicated as "Fair" by
Kellermann et al due to the large error for the speed (.45 +/- .15 mas/year).
We have noted that components B and C consist of two subcomponents.
When we do the analysis using these subcomponents, the motions are again
consistent with the speeds found by Kellermann et al (2004).
Core shift analysis
The core component is most likely not at the position
of the presumed black hole, but at the base of the jet, whose position
may vary with frequency due to optical depth effects. This effect has
been sought in the present data by matching components B, C, and F as
fit to the 15 GHz data with the nearest components fit at the other two
frequencies. In Figure 5 the maps at the three frequencies are show for
the Feb 28 epoch with lines indicating the corresponding components.
In Table 6 we list the distances of each component
from the core at the three frequencies and three epochs.
An error analysis similar to what was done for the 15 GHz models described
in the last section gives us error estimates, which are indicated in
Table 6.
Table 6. Component distances from core in mas
| Component | Epoch | 5.0 GHz | 8.4 GHz | 15.4 GHz
|
| B
| Feb 28
Apr 01
Apr 30
| 2.41(0.10)
2.46(0.10)
2.40(0.10)
| 2.71(0.10)
2.46(0.10)
2.50(0.10)
| 2.41(0.11)
2.38(0.11)
2.49(0.11)
|
| C
| Feb 28
Apr 01
Apr 30
| 4.08(0.10)
4.10(0.10)
4.18(0.10)
| 4.27(0.10)
4.38(0.11)
4.32(0.11)
| 4.40(0.14)
4.42(0.12)
4.60(0.14)
|
| F
| Feb 28
Apr 01
Apr 30
| 6.84(0.10)
6.93(0.10)
6.90(0.10)
| 6.93(0.12)
7.10(0.12)
7.02(0.12)
| 7.22(0.19)
7.31(0.20)
7.40(0.22)
|
Figure 4. Offsets from core as function of frequency.
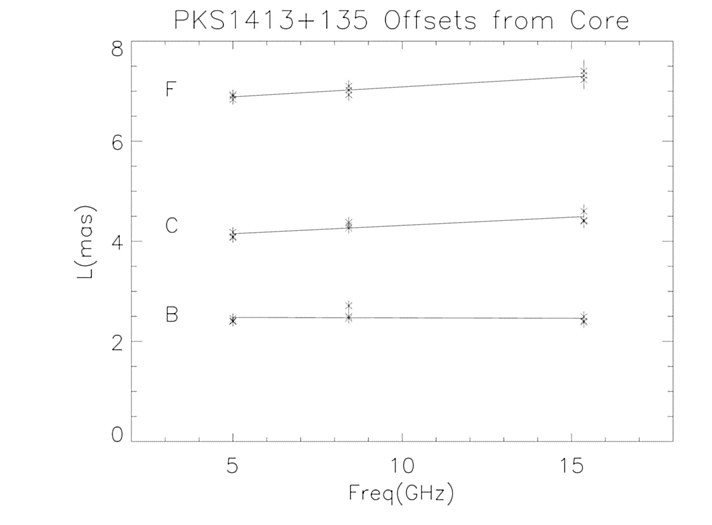
The offsets are plotted as a function of frequency in Figure 4.
The solid lines show linear least squares fits to the core offset (L)
for each component. Table 7 gives the fit parameters.
One may notice that the slope is different from zero at the
3-sigma level for components C and F.
Table 7. Fits for core shift vs Frequency
| Component | Slope (mas/GHz) | Error (mas/GHz)
|
| B | -0.002 | 0.008 |
| C | 0.033 | 0.009 |
| B | 0.040 | 0.012 |


