Laboratory Tests
Yury Korneev, Alexander Smirnov and Boris Kanevsky arrived in Green Bank, along with the test set, late on May 21. The equipment was not unpacked until the morning of May 22, 1999. Possible interference to the 140 foot (43 meter) telescope observations dictated that all testing should be in the laboratory until the morning of May 25, 1999. From May 22 through May 24, 1999, the Russian modules were set up in the laboratory. This was done to test the equipment after shipping and to measure the characteristics of the Russian test set.
Initially, the command generator was found to have a problem. It wouldn't turn the transmitter off, but otherwise the VIRK locked to the incoming 8 GHz band uplink generated within the Russian test set. The VIRK could transmit in the 8 GHz and 15 GHz bands. This problem persisted for all of May 22, 1999. We were not able to perform any tests on this day as the Russians attempted to fix the command generator. The problem with the command generator ``magically'' disappeared overnight. However, on the morning of May 23, 1999, the VIRK wouldn't lock to the 8 GHz band uplink signal. The VIRK was switched to the other transponder (from A to B) and the system then worked. The problem with the 8 GHz band uplink not locking was never determined.
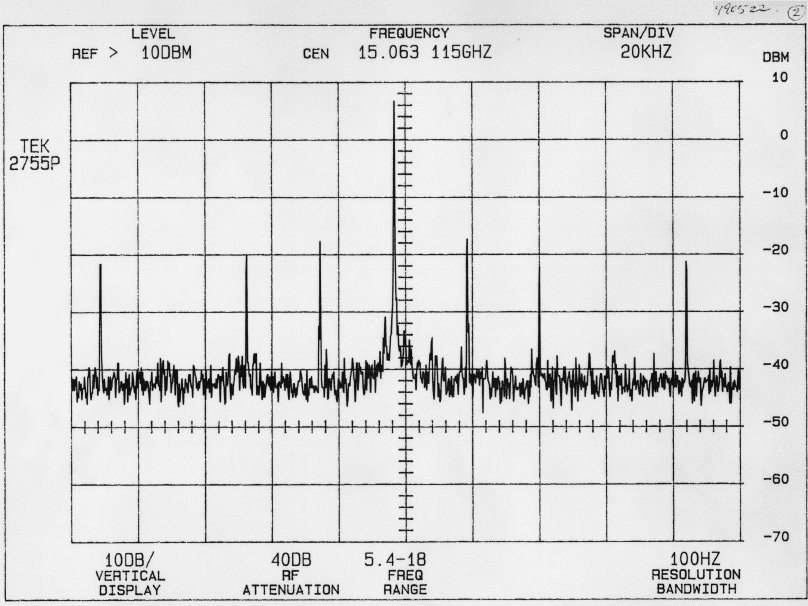
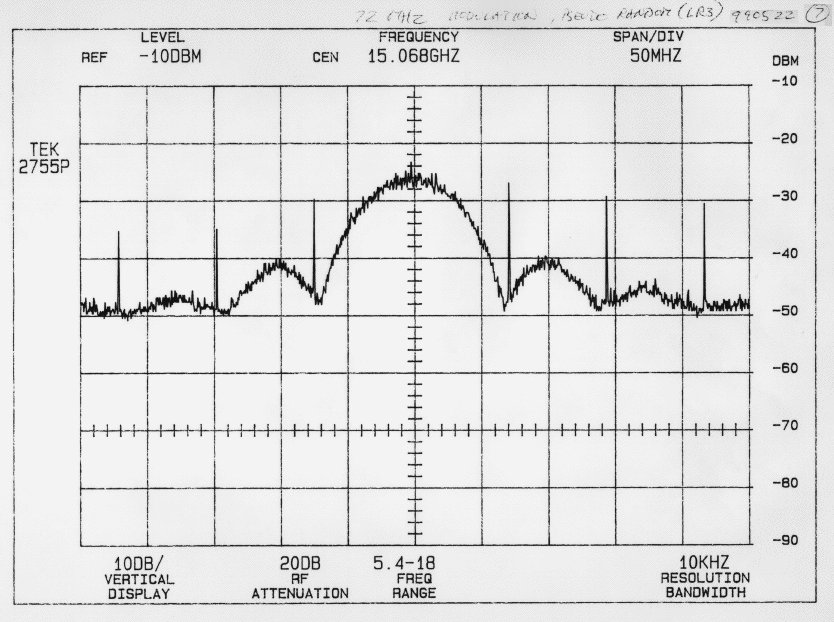
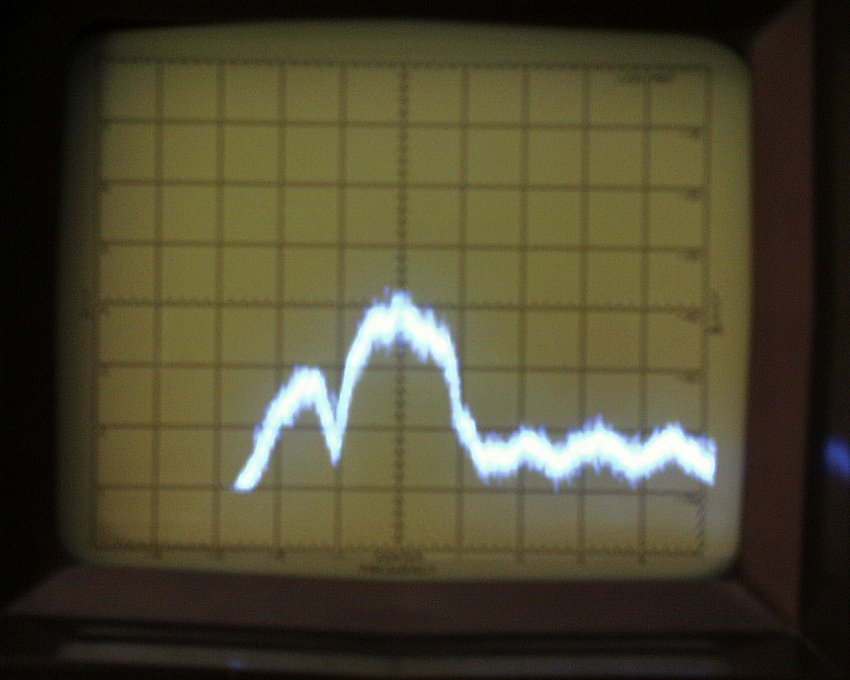
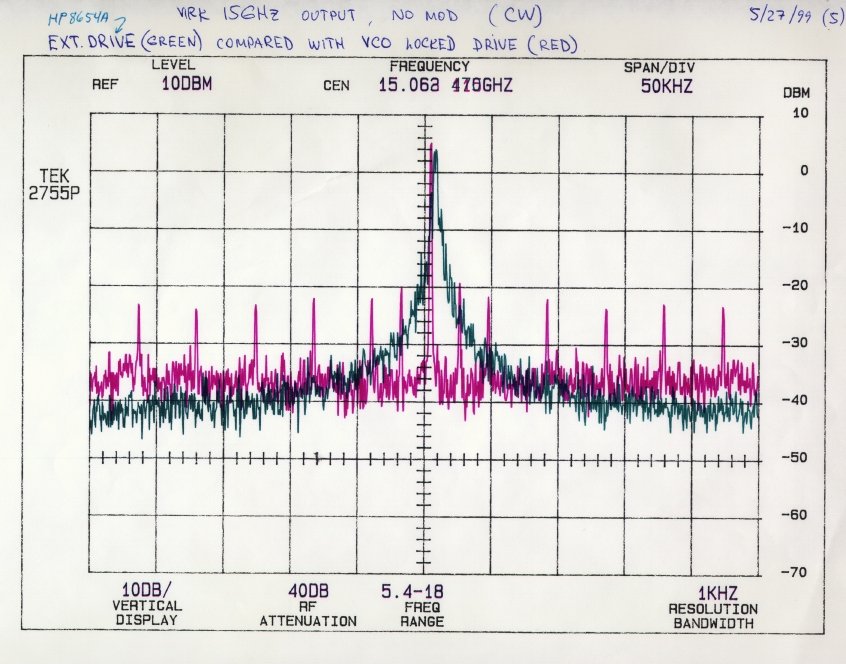
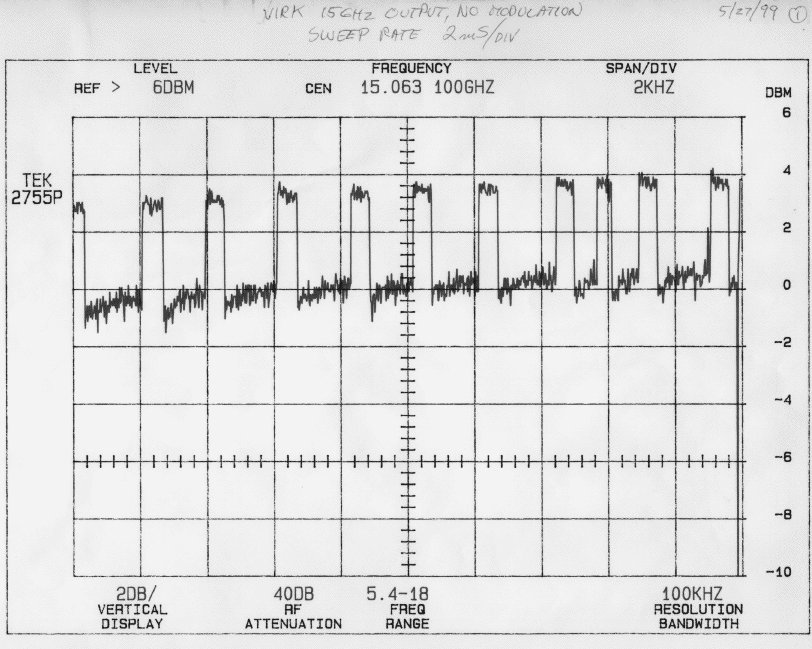
Spectral plots of the
15 GHz band output of the VIRK using their test set to produce the
signal reference were obtained
(Figures 4 and 5). Note that the Russian test set uses a
14.71 MHz crystal oscillator doubled 9 times to 7215 MHz as an uplink signal.
The output signal was not modulated.
The 15 GHz band peak power output was measured at +40.5 dBm (11 Watts).
Many spurs were seen in the 15 GHz band output of the VIRK. These spurs
have amplitudes up to +25.6 dBm (0.36 Watts), only about 20 dBm below the
peak power output. Far from the central peak the spurs appear to be
evenly spaced in frequency by roughly 42.6 kHz. Near the central peak there
are two ``extra'' spurs roughly 21.3 kHz from the the central peak.
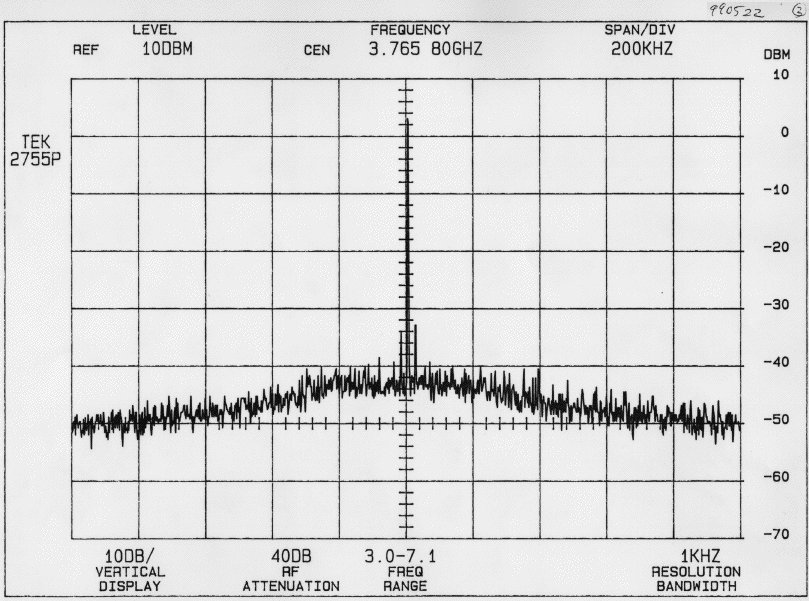
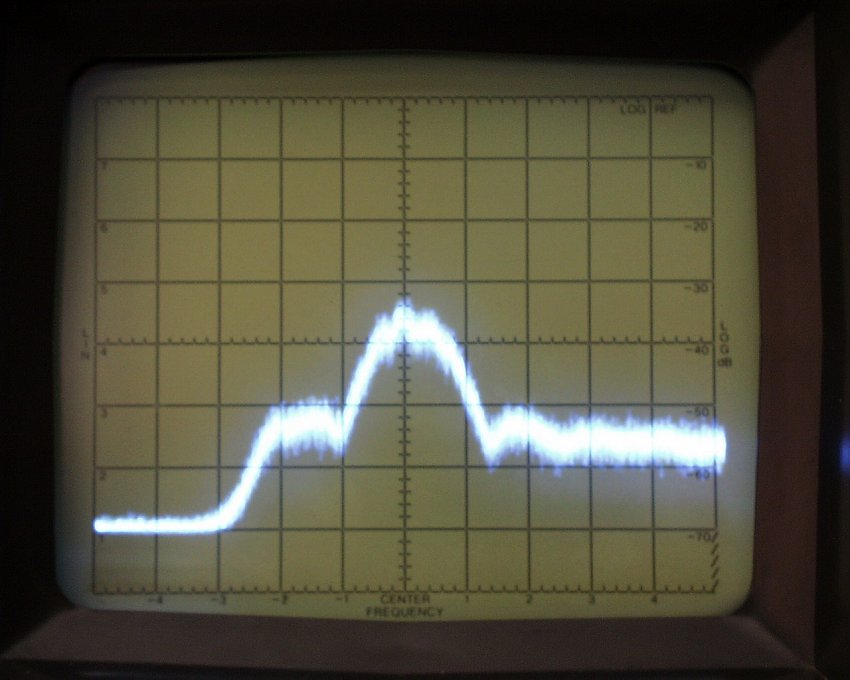
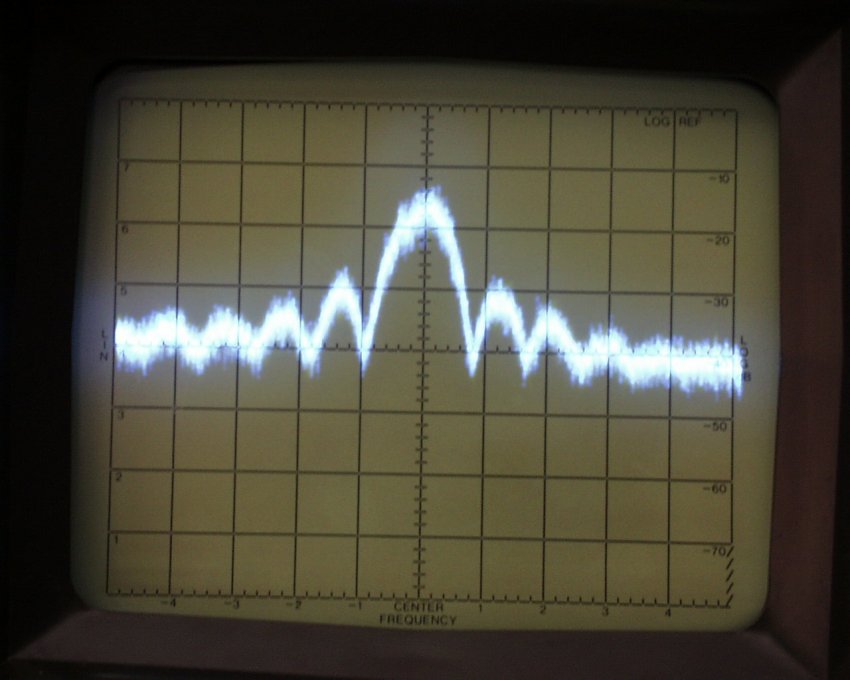
In Figures 6 and 7 the spectrum of the VIRK 15 GHz band transmitter where
obtained at the IF frequency of 3.765 GHz before being multiplied
![]() up to 15 GHz. The 3.765 GHz signal was obtained
from a test port that was in the VIRK, used by the Russians to obtain a
clock reference for the demodulator.
The spurs are present at this
stage of the transmitter
IF chain but are at a much lower level relative to the main
peak. The source of these spurs was later isolated to be from the
14.71 MHz oscillator within
the Russian test set and not from within the VIRK.
up to 15 GHz. The 3.765 GHz signal was obtained
from a test port that was in the VIRK, used by the Russians to obtain a
clock reference for the demodulator.
The spurs are present at this
stage of the transmitter
IF chain but are at a much lower level relative to the main
peak. The source of these spurs was later isolated to be from the
14.71 MHz oscillator within
the Russian test set and not from within the VIRK.
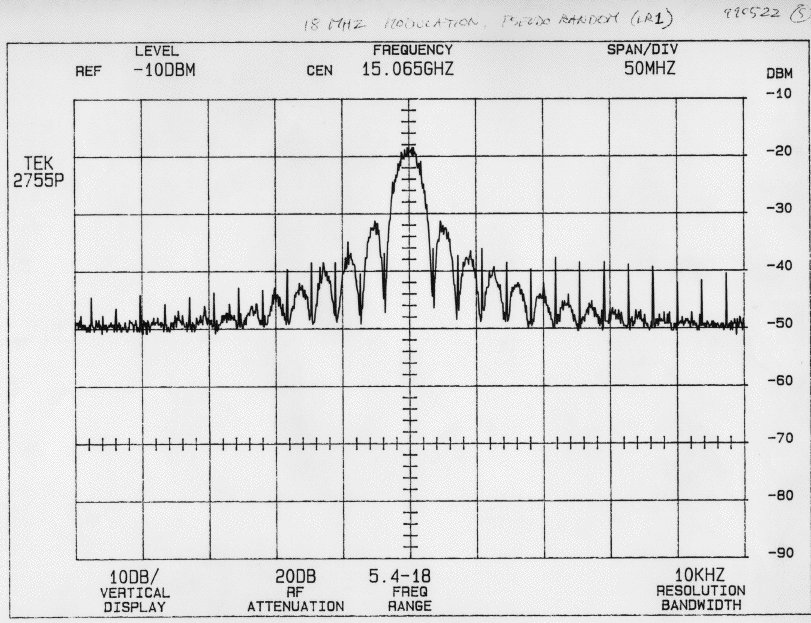
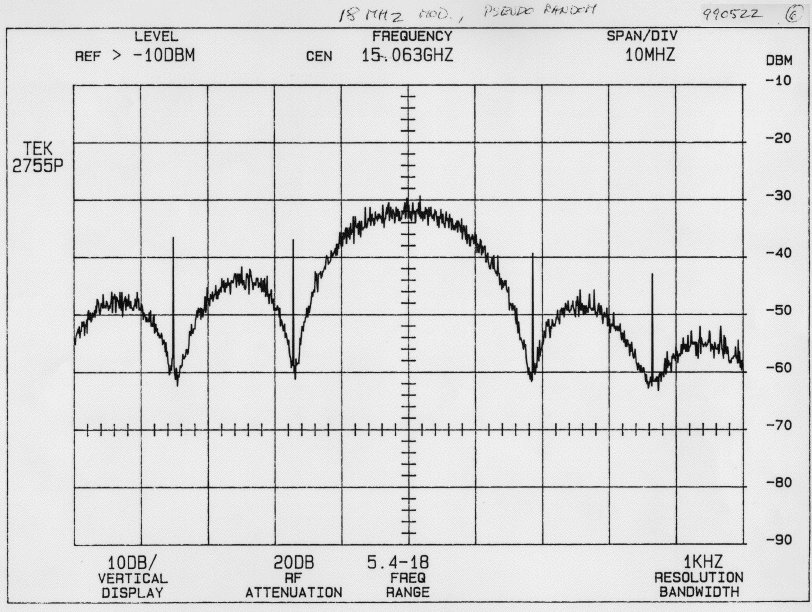
In Figures 8-10 spectra of the VIRK 15 GHz band output were measured. In these measurements the output signal was modulated with an 18 MHz clock rate in Figures 8 and 9 and a 72 MHz clock rate in Figure 10. At each ``null'' in these spectra there is a strong clock rate spur. These spurs have amplitudes up to +25 dBm and are as little as -3 dBm below the peak power output at the central frequency. The spurs suggest that there is an inbalance in the modulator.
All tests performed in the laboratory used only the Russian test sets. No NRAO equipment was used during these tests other than the power supplies.
|
|
|
|
|
|
|
|
|
|
|
|
|
|
Radiative Tests
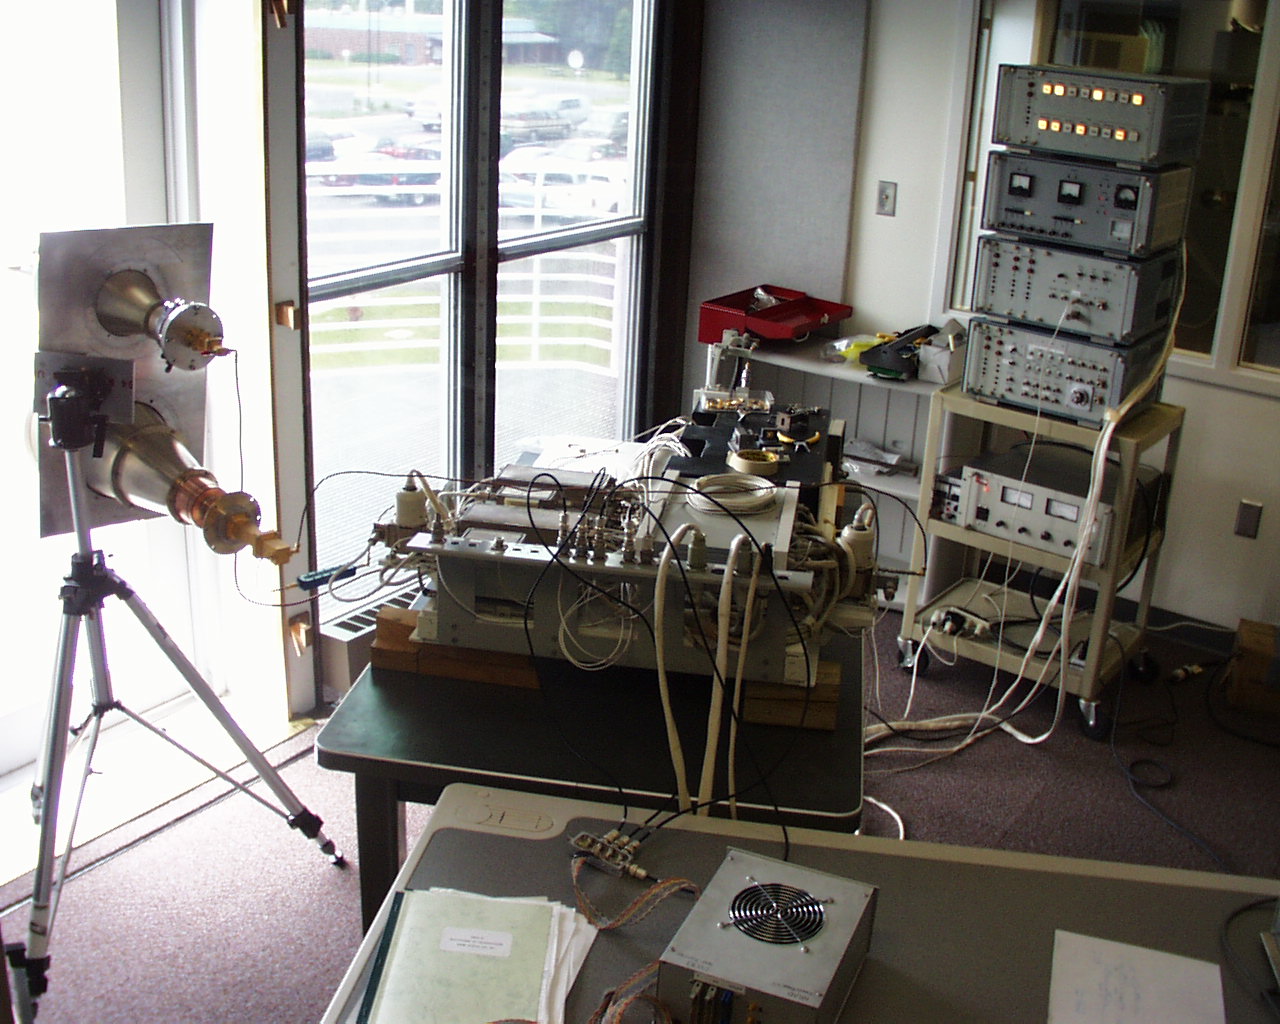
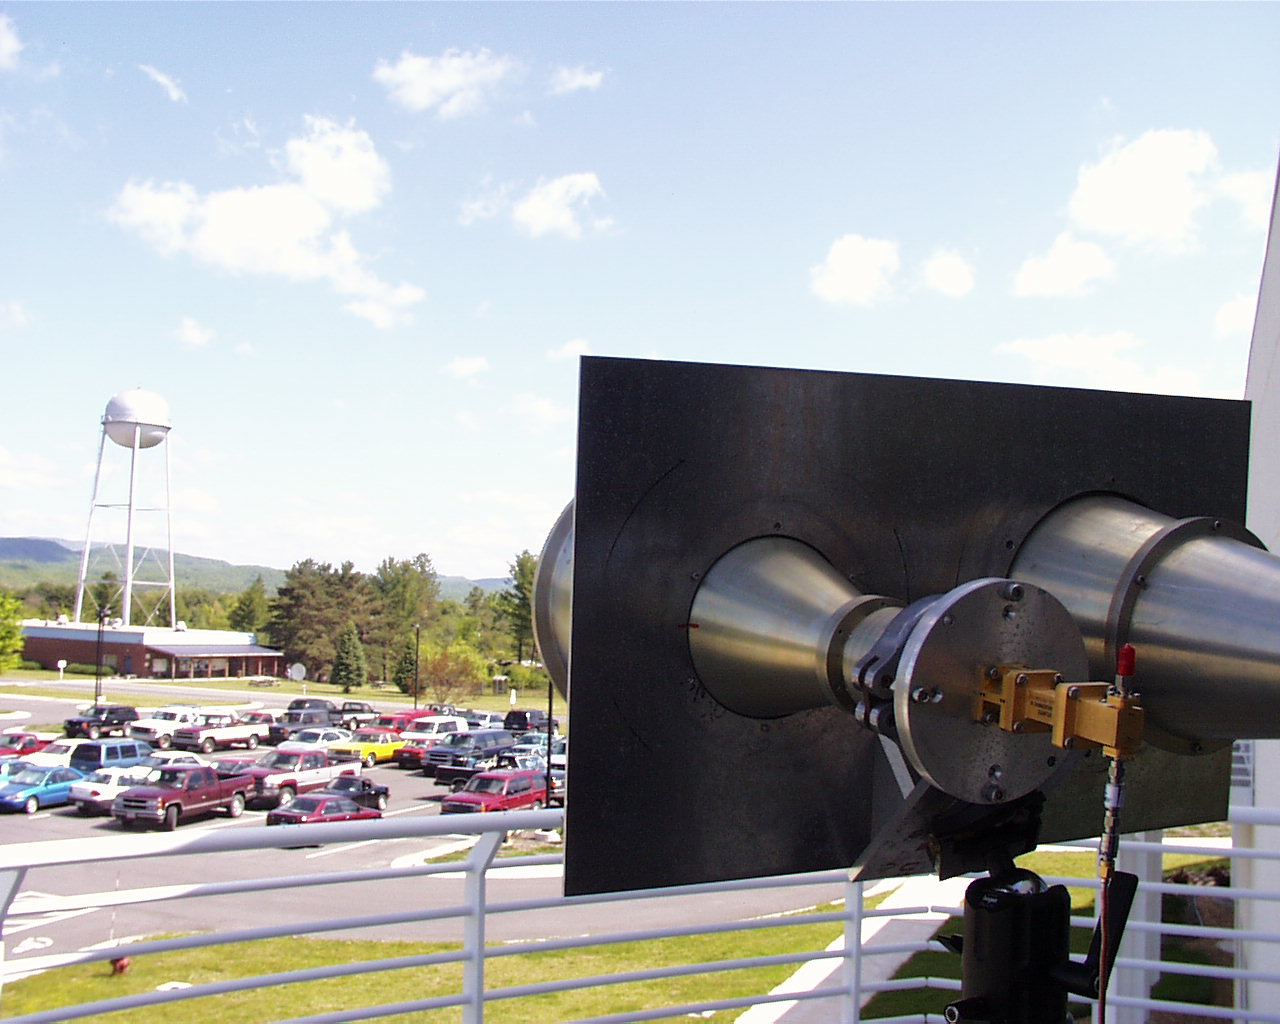
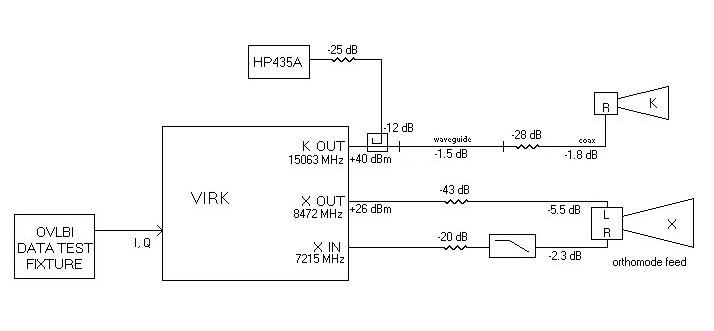
The Russian test set was moved to the Green Bank Telescope (GBT) control room during the afternoon of May 24, 1999 in preparation for the radiative link tests that could begin on May 25. The setup is shown in Figures 11 and 12 with a block diagram of the setup shown in Figure 13.
The first on-air tests with the earth station were performed on May 25, 1999. The earth station antenna was aimed, as near as possible, in a direction towards the balcony/window of the GBT control room where the Russian modules were located. The balcony is at an azimuth of 130 degrees and an elevation of 0.7 degrees relative to the earth station. The earth station antenna was actually pointed at an azimuth of 130 degrees and an elevation of 4 degrees. The balcony is in the near field of the earth station located roughly 380 meters away. The line of sight between the earth station and the GBT control room balcony was partially blocked ( 50%) by a tree located near the earth station. Initially it was thought that this tree would not provide too much attenuation of the signals but this eventually did not prove to be the case. It was then decided to reflect the signal off of the NRAO site water tower (as shown in Figure 12) due to the high signal loss from the ``arboreous attenuation''. The water tower is located ~250 meters from the earth station and ~230 meters from the GBT control room. The signals were reflected by an angle of ~95 degrees off of the water tower in traveling between the earth station and the GBT control room. Note however that the water tower is not a ``flat plate'' reflector - the surface of the water tower is roughly spherical.
Two-way lock was achieved easily, surprisingly without the feed horn
(8 GHz band receiver) connected to the VIRK. In fact the connector on the
VIRK for the feed horn was
terminated. The lock was achieved with the earth station trasmittor outputting 0.2
Watts. This roughly corresponds to a flux density of
![]() Watts/
Watts/![]() at the VIRK.
It was curious that this initial lock without the feed horn occurred at a
power level transmitted by the earth station that is very close to that required to
achieve lock with the VIRK when the 8 GHz feed horn was attached to the VIRK.
It appeared that there
must have been an RF leak in the VIRK 8 GHz band receive system.
at the VIRK.
It was curious that this initial lock without the feed horn occurred at a
power level transmitted by the earth station that is very close to that required to
achieve lock with the VIRK when the 8 GHz feed horn was attached to the VIRK.
It appeared that there
must have been an RF leak in the VIRK 8 GHz band receive system.
The VIRK 8 GHz band power output was measured to be 400 milliwatts.
A 10 minute round-trip lock test of the two-way timing phase stability was performed (see Figures 14-15). The first five minutes of this test were used to adjust/tune the earth station receivers and LOs to the proper frequencies. These tests used a pseudo-orbit file that was designed to simulate a residual ``Doppler'' frequency of approximately -1.5 Hz on the two-way timing link.
It should also be noted that once the earth station began uplinking the timing signal (nominal 7215.255 MHz CW signal) it could take upwards of several minutes for the VIRK to produce a downlink signal that could be used for timing measurements.1 This delay was always present whenever a link was established with the VIRK. During this delay the VIRK was transmitting a down link signal that was detected by the earth station. However the phases were not stable enough for the earth station to have its Costas loop lock to the downlink signal. When the NRAO satellite simulator was used instead of the VIRK there was no delay between when the uplink began and the time that good timing measurements on the round trip phase were obtained. This indicates that the source of the several minutes delay is within the VIRK-M module.
|
|
|
|
|
|
The two-way timing link during this 10 minute round-trip lock test proved to be relatively noisy with an RMS noise level about an order of magnitude larger than what is observed for the two-way timing link to the Japanese space VLBI satellite, HALCA, which is in orbit (see Figures 15 and 16).
An overnight phase stability test for the 8 GHz band two-way timing link was started around 21:30 UTC, May 26, 1999. This test ran for approximately 16 hours. Plots of the resulting residual phases and RMS noise are shown in Figures 17 and 18. The noise level for this test was generally simular to what is observed for HALCA. More detailed results from this test are presented in a latter section of this document.
|
|
|
|
On May 26 and 27, 1999, many measurements of the bit error rate on the 15 GHz data downlink were made. Measurements were attempted in all three RadioAstron clock rate modes - 18, 36 and 72 MHz. These tests were performed in the following way. The earth station uplinked a CW signal at the nominal frequency of 7215.255 MHz. The VIRK received this signal and used the received phase as a reference for the downlinks in the 8 and 15 GHz bands. The NRAO OVLBI test data fixture was used to provide a pseudo-random bit-stream to the VIRK for the simulated radio astronomy data. The VIRK modulated this data onto the 15 GHz downlink signal. The received 15 GHz band signal received at the earth station was sent to the NRAO decoder. The decoder searches for the frame header keywords and once found processes the data from a given frame. The decoder also analyzes the parity check provided on the RadioAstron downlink signal and is reported as the ``frame parity error rate''. A minimum value for the bit error rate can then be determined by taking the frame parity error rate per frame and dividing by the number of bits per frame. A maximum value of the bit error rate can be determined by assuming that the parity errors are uniformly distributed across the frame so that the parity error rate equals the bit error rate.
The received spectrum for the data link (15 GHz band) at the
earth station was not smooth or stable.
Valid frame header synchronization
was detected most of the time, but the frame
parity error rate was one part in 10 to one part in 100
(![]() bit error rate
bit error rate
![]() ).
).
It was decided to try the NRAO satellite simulator instead of the VIRK, over the same path with the same antennas in order to determine if the problem was with the earth station or the VIRK. The power output of the satellite simulator was -6 dBm. This is not enough power, once transmitted from the GBT control room to the earth station for the decoder to be able to find the frame headers for 16 consecutive frames which is required to declare valid frame synchronization. A 15 GHz band amplifier was required to get the signal from the satellite simulator strong enough for the link to provide valid frame synchronization (see figure 19). The tests with the NRAO satellite simulator used the nominal uplink and downlink frequencies of 15.4453 and 14.0283 GHz respectively. The setup of the NRAO satellite simulator in the GBT control room was not completed until May 27. The tests with the NRAO satellite simulator had zero errors over about five minutes integration time for the 18, 36 and 64 MHz (HALCA mode) clock rate modes. The bit error rates were similar to those measured for the VIRK in the 72 MHz clock rate mode of the NRAO satellite simulator. No errors were measured in this mode when the NRAO satellite simulator was connected directly to the earth station hardware. This suggests that the errors are introduced along the propagation path.
|
|
The results of the 15 GHz link tests using the NRAO satellite simulator are shown in Figures 20-23. In Figures 20 and 21 we show the spectrum received at the earth station from the NRAO satellite simulator at two different transmitter power levels. The signal is modulated at the VSOP clock rate of 64 MHz in both of these figures. Over several minutes integration time no bit errors were detected for these tests. In Figure 22 we show a spectrum of the received signal at the earth station from the VIRK. The signal is modulated with a clock rate of 18 MHz in this figure. No valid frames were detected from the VIRK. In Figure 22 the resolution bandwidth is not small enough to see the spurs at each of the nulls in the spectrum. Comparing Figures 20-22 it can be seen that the amplitudes of the ``side-bands'' are much larger for the RadioAstron downlink than for the NRAO satellite simulator. It is possible that these large amplitude side-bands could be the source of the large parity error rates through a ``false lock'' of the NRAO decoder to the VIRK downlink signal. This possibility was not investigated.
|
|
|
|
|
|
|
|
Next the connection between the NRAO test data fixture and the VIRK was checked. The ECL modulator inputs on the VIRK were found to be non-standard. They were measured to determine the DC bias with the inputs disconnected. The bias point was at the half-way point for an ECL, -1.4 volts. Apparently, the external signals provided to the VIRK modulator are expected to be AC coupled. The Russian's schematic of the modulator driver shows that the termination to 50 ohms is AC coupled, with the DC bias applied through a greater than 1K ohm termination. With the NRAO test fixture (with its internal pull-down resistors) connected to the VIRK, the data levels were acceptable ECL levels (-1.1 and -1.8 volts) and they are buffered by internal ECL logic so that input levels would not affect the QPSK modulator. The connection of the NRAO test data fixture with the VIRK was found to be satisfactory and not the source of the observed problems.
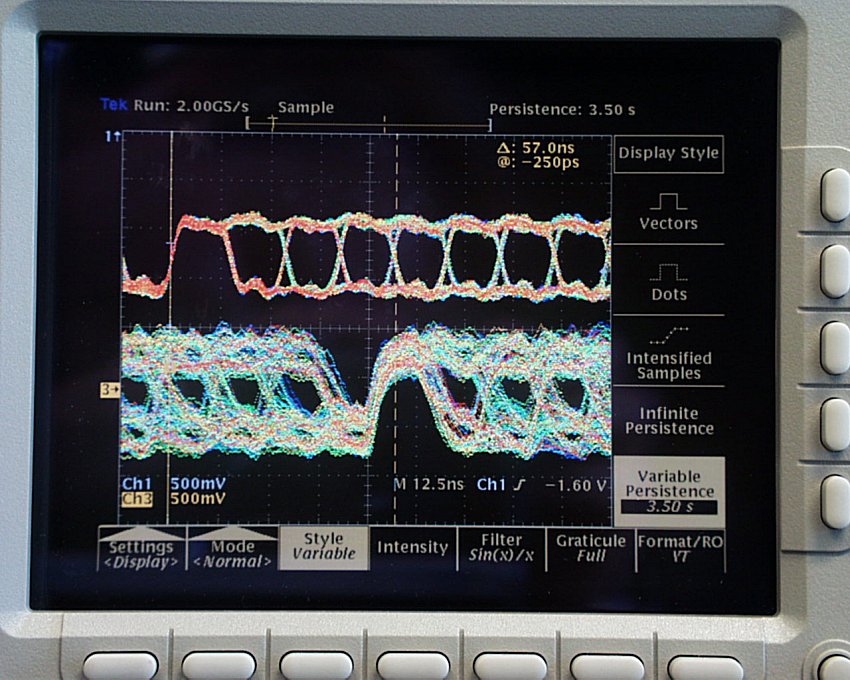
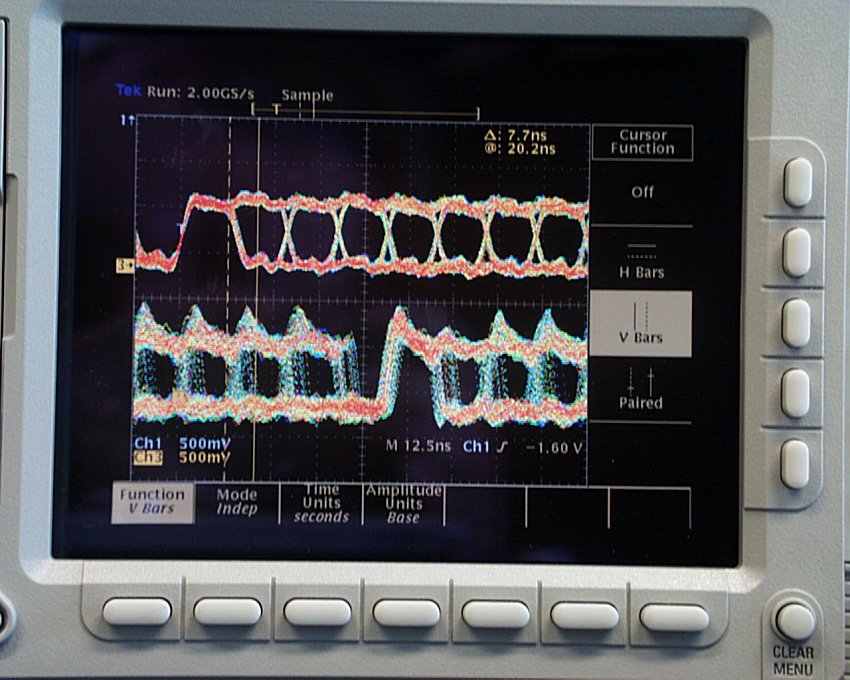
It must be concluded that the problem with the high error rates on the 15 GHz band data signal is inside the VIRK-M module, probably with the modulator. A check of the demodulated analog signals coming from the Russian demodulator shows much jitter (see Figures 24 and 25). The Russians are feeding this demodulator with 1 milliwatt of input signal, and it has no clock recovery circuitry - the clock is provided directly around the RF link via a test port in the VIRK which outputs a 3.765 GHz reference signal obtained from the 3.765 GHz stage of the 15 GHZ band transmitter.
|
|
|
|
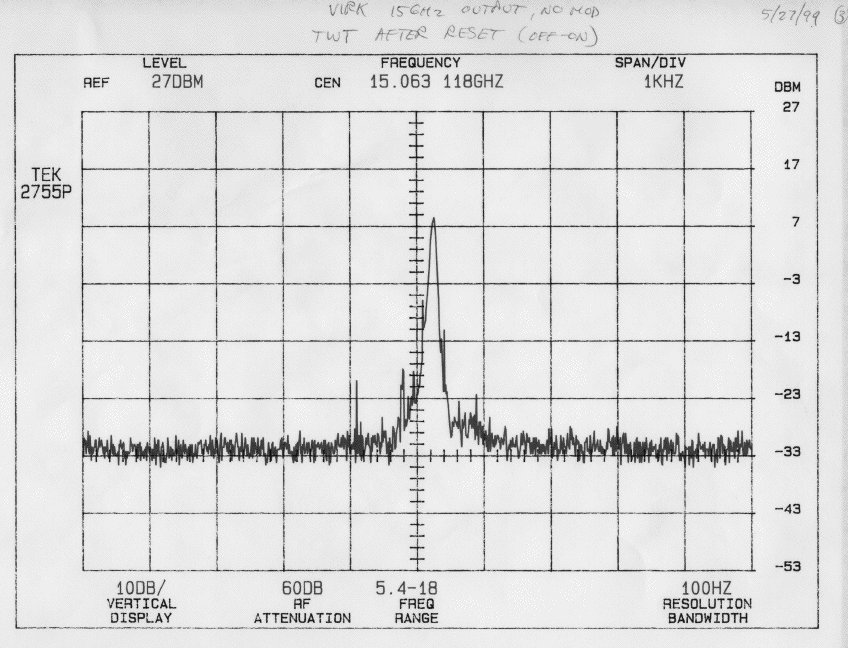
Also note that during these tests, an anomalous mode was detected in the VIRK 15 GHz band transmitter, which the Russians were aware of. The 15 GHz band output appeared to have a 500 Hz square wave amplitude modulated onto it (see Figures 26-29). It was determined by Korneev, Smirnov and Kanevsky that this amplitude modulation was arising from an instability in the traveling wave tube amplifier - driven by the traveling wave tube overheating due to having its cooling fans turned off. Powering down the VIRK system and then turning it back on - with the fans now operating - cleared this problem.
|
|
|
|
|
|
The problem with the VIRK modulator could not be investigated or fixed within the time alloted for the compatibility tests. No valid measurements of the bit error rates could be made during these tests due to the problems with the modulator.
On Friday, May 28, 1999 we decided to test the lock range of the VIRK 8 GHz band system. In Figure 30 we show a block diagram of the setup for these tests. An HP 83620 was used to provide a source signal input directly into the 8 GHz band uplink receiver of the VIRK. The VIRK test set lock indicator was used to determine if the VIRK was locked to the source signal. Both the input frequency and the power level were varied to study the lock and hold range of the VIRK module.
These tests showed that the lock range was limited mainly by the search sweep
range of the PLL, as the frequency limits were not power level sensitive.
The input capture range was from 7215.2670 to 7215.2320 MHz (+12 to -23 kHz),
and the hold range was 7215.26724 to 7215.232240 MHz (+26.5 to -23 kHz). The
hold range widened by about 1200 Hz when the input power was increased from -70
dBm to -50 dBm.
Note that the hold range measurements were very sensitive to the
rate of change of the received signal's frequency near the limits
of the hold range - within ~500 Hz of the edges of the hold range.
Here we had to move
the signal source in 1 Hz steps, at a maximum rate of
about 1 step per second, to hold lock at the extremes. Within the center of
the hold range, roughly 7215.2665 to 7215.2325 MHz, the rate of change
of the frequency of the signal did not matter.
The VIRK would lock to any signal ![]() dBm (
8.9 x 10⁻¹⁴
Watts).
The VIRK
would not lock to a signal
dBm (
8.9 x 10⁻¹⁴
Watts).
The VIRK
would not lock to a signal ![]() dBm (
7.1 x 10⁻¹⁴
Watts).
Note that the power level for
the inputs could only be changed in increments of 1 dBm for this test.
If the VIRK was locked to a signal it would lose lock as soon as the
signal dropped below -100.5 dBm.
dBm (
7.1 x 10⁻¹⁴
Watts).
Note that the power level for
the inputs could only be changed in increments of 1 dBm for this test.
If the VIRK was locked to a signal it would lose lock as soon as the
signal dropped below -100.5 dBm.
After the lock range testing, the equipment was torn down and packed. The equipment left Green Bank at noon on May 28, 1999.