
3mm Weather in Green Bank
Opacity
The GBT is located at a mid-latitude, 2800' elevation site which nevertheless provides substantial useful 90 GHz observing conditions in the Fall, Winter, and Spring. We have three main sources of information to assess the Green Bank weather: site weather station data; measurements of the 86 GHz sky brightness temperature with an on-site tipper (2000-2001); and emissivity models that use atmospheric profile data from the national weather surface (see Ron Maddalena's weather pages for more information on these). The atmospheric emissivity models are those of Liebe (1985), Danese & Partridge (1989), and Pardo et al. (2001). The fundamental limit to the amount of useful observing time is set by water vapor and clouds. From Oct 1 through May 1, weather data plus atmospheric emissivity models and direct tipper measurements both indicate that the 86 GHz zenith opacity is 0.12 or less 45 to 55% of the time. This corresponds to a zenith atmosphere brightness temperature of roughly 32 Kelvin, and a precipitable water vapor column of 10mm in the absence of clouds. The opacity numbers quoted include the contributions both of the "dry" atmosphere, water vapor, and hydrosols (clouds). The mode of the precipitable water vapor (PWV) distribution in Green Bank over the high-frequency observing season is between 5 and 6 mm. Note that due to the proximity of the pressure-broadened oxygen line there is a significan (~8 K, or tau of 0.03) "dry" 90 GHz sky brightness. Our results are consistent with measurements of the 90 GHz sky brightness on White Mountain, with PWV values ranging from 0.2mm to 6mm, by Bersanelli et al. (1995).
The cumulant of 86 GHz opacity predicted from national weather service atmospheric profile data for each GBT high frequency observing season from 2004-2009. (Plot courtesy of Ron Maddalena, NRAO)
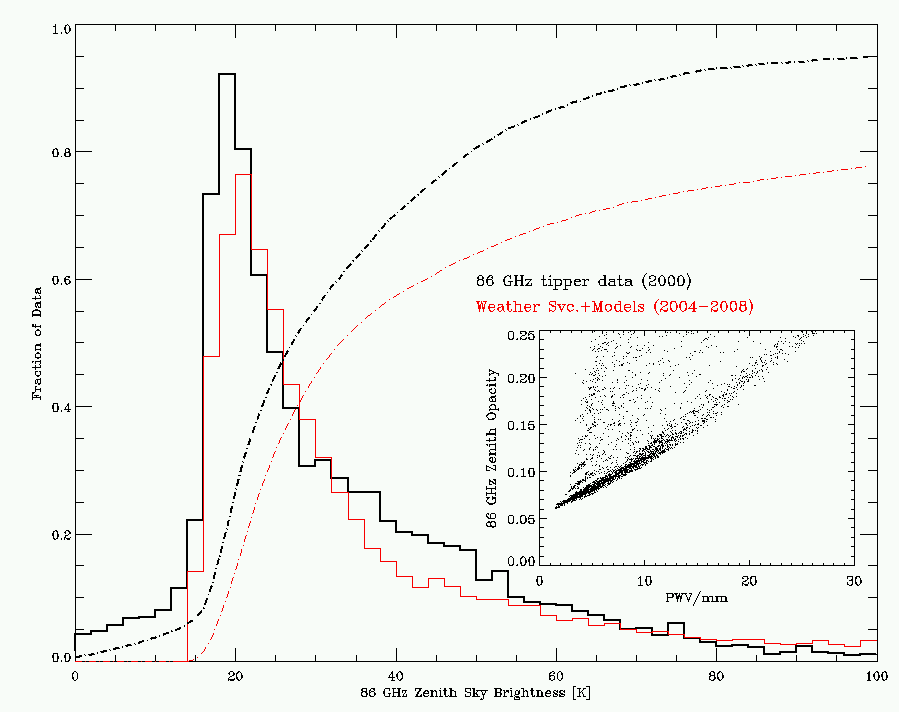
The zenith atmospheric brightness temperature determined by direct 86 GHz tipper measurements (black, year 2000) and from the atmospheric profile models (red, 2004-2009 high frequency seasons). Solid lines show the distribution and dash-dot lines the cumuluant. The inset plot shows the 86 GHz zenith opacity vs precipitable water vapor in millimeters for the 2004-2009 data. The scatter to high opacity results from cloud cover. The tail of the tipper measurements at low sky brightness is due to a few measurements with large error bars; to avoid biasing the distribution we do not censor the large-error bar tipper measurements. (Data courtesy of Ron Maddalena, NRAO)
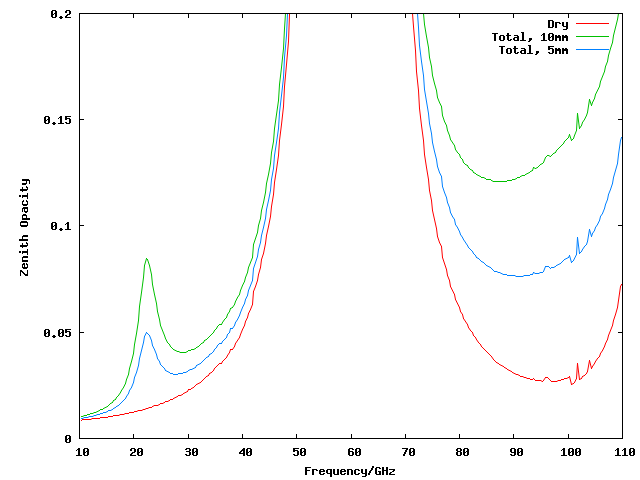
Atmospheric opacities at zenith for a dry atmosphere, with 5mm precipitable water vapor (pwv), and with 10mm pwv. Values calculated by ATM for the elevation of the Green Bank site.
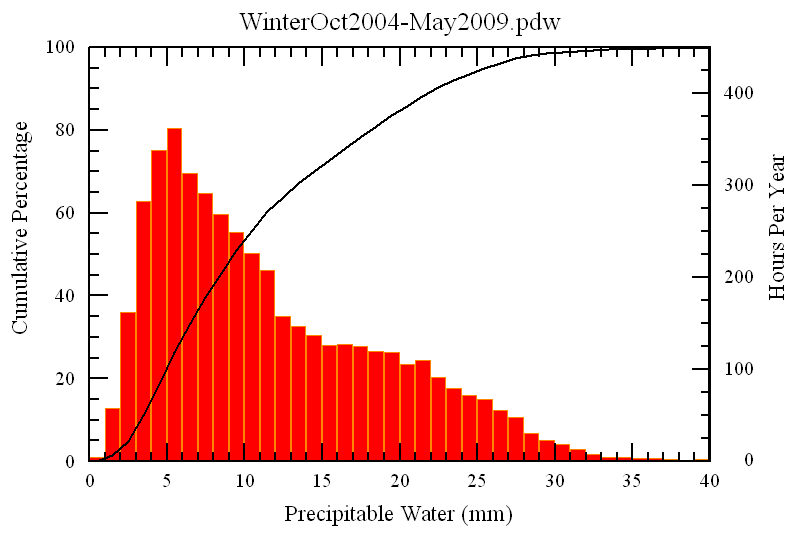
The distribution of precipitable water vapor (PWV) between Oct 1 and May 1 (2004-2009), and the cumulant of this distribution.
GBT Structural Limitations
The telescope structure imposes futher limits to 90 GHz observations with the GBT. At present, reliable 3mm observations can only be carried out at night with the GBT because the changing solar illumination gives rise to unacceptable structural changes. For similar reasons, 90 GHz observations can only be usefully carried out under reasonably calm wind conditions. For MUSTANG this limit is about 8 miles per hour; because it is a mapping instrument which always observes "on the fly", the wind constraint is less restrictive than it would be for a 90 GHz single-pixel, photometric instrument for example.Considering the structure and opacity limits together there are on average about 90 nights of useful MUSTANG observing conditions per year. Of these, 40 nights-- just under 500 hours-- have excellent conditions (calm, clear, less than 8mm pwv). The structural (wind, day/night) limits are not fundamental: they can be improved with better metrology and modelling, resulting in more useful observing hours.