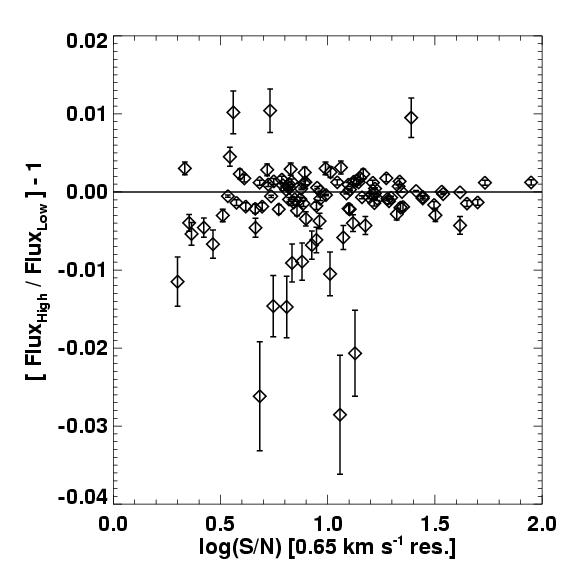
Difference between the flux values at low (8.5 km/s at 1420 MHz) and high
(0.65 km/s at 1420 MHz) resolution versus the average signal-to-noise of the
observations (flux divided by W20). Both the average,
weighted by rms-2, and median values are zero.
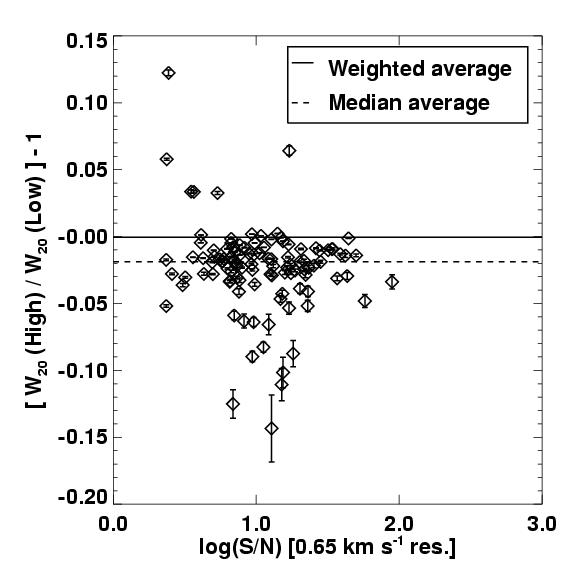
Difference between the flux values at low (8.5 km/s at 1420 MHz) and high
(0.65 km/s at 1420 MHz) resolution versus the average signal-to-noise of the
observations (flux divided by W20). The weighted average and median
values are shown by the solid and dashed lines, respectively. Additionally, two
1st order lines have been fit to the data. The solid blue line is the best fit line to the
data when weighted by rms-2 and the dotted line is the best fit to the
unweighted data.
|