Introduction to Science in the Galactic Plane

Lesson 2: Image Analysis

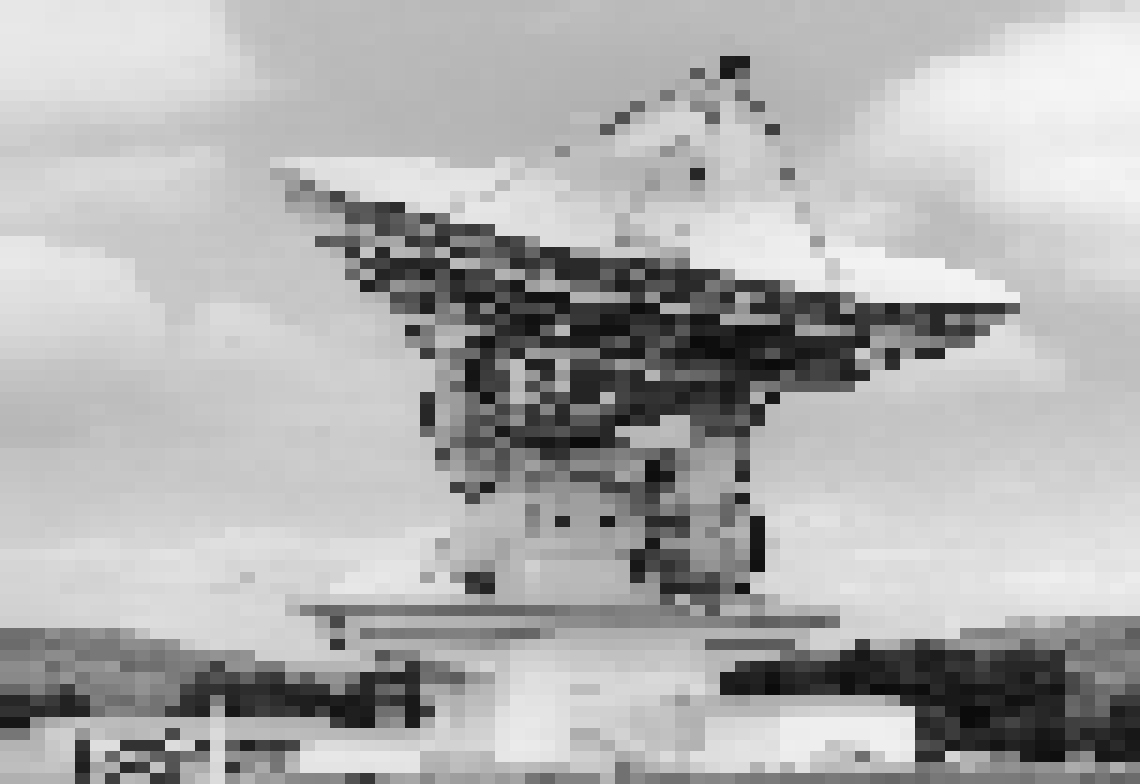
Our Galaxy with annotations 140 foot radio telescope

PURPOSE

This is the first in a series of exercises that allows a student to perform analysis of real radio-astronomical data. During the course of this and the following exercises, the student-experimenter will analyze images taken by the Green Bank Earth Station. The Green Bank Earth station uses a 45 foot parabolic antenna connected to a very sensitive radio receiver operating in the microwave part of the electromagnetic spectrum. The frequencies of the receiver are 8.35 GHz (wavelength of 3.6 cm) and 14.35 GHz (wavelength of 2.1 cm). This activity is usable for high school physical science, astronomy, and physics classes

INTRODUCTION

The planet Earth orbits a star that resides in a spiral arm of the Milky Way galaxy. Our planet is about 26,000 light years distant from the center of the galaxy. As we observe the galaxy, we see it as an 'edge-on' view. Think of looking at the edge of a pancake rather than at the top of the pancake. As a result of the clouds of dust and hydrogen gas, visible light tends not to penetrate well throughout the galaxy. Radio waves pass through these regions with greater ease; therefore, radio astronomers are capable of viewing parts of the galaxy that are invisible to visible-light astronomers. In this exercise, you will be viewing the galaxy as a radio astronomer views the galaxy. Think of this as having a different pair of eyes.

THE PROJECT

In this project, you will use image processing software to load and analyze sets of images taken during the GPA survey. The analysis is based on a careful measurement of the intensity of the same object at the two survey frequencies. Those objects that yield a reasonably constant intensity will be classified as thermal objects. Those objects that yield a decreasing intensity as frequency increases will be classified as supernova remnants. Positional data for each identified object will then be obtained. Comparison between your measured position and the true position from astronomical tables will confirm your hypothesis.

A supernova remnant catalog is available on the World-Wide-Web at http://www.mrao.cam.ac.uk/surveys/snrs.

DESCRIPTION OF THE DATA

This CDROM contains calibrated radio wavelength images of the Milky Way (our galaxy). These images are obtained by the Green Bank Earth Station, a 45 foot diameter parabolic reflector and radio receiver operating in the microwave part of the radio spectrum. The receiver frequencies are 8.35 GHz and 14.35 GHz. The CDROM contains FITS images as well as software to analyze the images. FITS stands for Flexible Image Transport System. It is the standard format for recording and transmitting astronomical images and data. The images contain information on what part of the sky has been observed and what is the intensity of the radio signal from that part of the sky.

PREREQUISITES

To get the most out of this activity, students should have a basic understanding of the following concepts:
(a.) loading image processing software
(b) loading FITS images
(c) spiral galaxy
(d) mathematical analysis

IMAGE PROCESSING INSTRUCTIONS

Recommendation: students work in groups of NO MORE than 3/group; therefore, students are more individually involved in the research.
1. Navigate to the SIP icon on the CDROM and open the program.
2. Read the opening paragraph titled: 'How to process images with SIP'
3. Skip down and read the paragraph titled: 'Image analysis'
4. Choose 'back to SIP homepage'. Open SIP program using button.
5. Choose FILE OPEN; IMAGE FILE FROM USER'S MACHINE
6. Choose 'gpa' and filter; filter lists available files. Choose VIEW; change IMAGE DISPLAY PARAMETERS
7.
SET:minimum display value= 0;
maximum display value = 5;
colors= false color
APPLY

ANALYSIS TO BE PERFORMED BY STUDENTS

1. Choose ANALYZE and Determine Centroid or Instrumental Magnitude of Object. Take readings of x- and y-position, object instrumental magnitude, and object flux for the 10 brightest objects. Record this data in your data table.
2. Which object is brightest and which object is least bright at 8.35 GHz?
3. How does the brightness of radio sources compare with the same objects at visible wavelengths?
previous up next
Previous Up Next
Galactic Plane Science
2000-06-27

rwelsh@nrao.edu, glangsto@nrao.edu