Introduction to Science in the Galactic Plane
Lesson 6:Identifying Radio Sources According to their Wavelength
PURPOSE
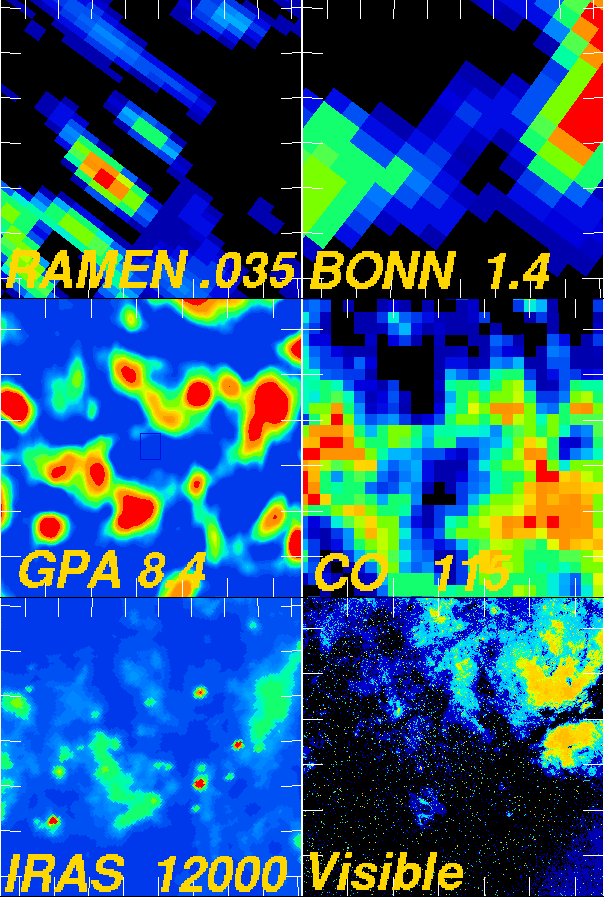
This exercise will allow the instructor/teacher to present to his/her students a lesson on the identification of radio sources from the First Galactic Plane Survey. For this exercise, a set of images of the same object taken at different wavelengths in the electromagnetic spectrum will be compared.


|
As stated in a previous lesson, the First Galactic Plane Survey is an observation of the plane of the Milky Way Galaxy taken simultaneously at two different frequencies in the microwave part of the radio spectrum. Viewing that same radio object at different wavelengths yields a different picture. Each wavelength picture contains information about the energy and temperature of the object. In this lesson, you will continue to analyze images taken by the Green Bank Earth Station. You will continue to use the Sky Image Processor software. The result of your analysis will be intensity measurements taken on a group of different radio sources. |

|
You will observe each of the objects at 5 different wavelengths. From your observations, you will create your own map of each object. Finally, you will combine each map into a single map that shows how the image differs when observed at different wavelengths. Be sure to label each drawing according to its wavelength. |

|
Navigate to NASA's SkyView website. SkyView is a virtual telescope that allows the user to view astronomical objects at many different wavelengths. For this exercise, choose Radio, Infrared, Optical, soft X-ray, and hard X-ray. An easy first use of SkyView is to use 'Quick SkyView Image' in the upper right corner of the home page. Just choose coordinates or source by name, wavelength band, and click on 'GO'. An image of the object of interest will be displayed. More choices at different wavelengths may be found in the BASIC interface. The SkyView website may be found by navigating to: http://skyview.gsfc.nasa.gov/ |
QUESTIONS TO BE ANSWERED BASED ON YOUR UNDERSTANDING OF THIS EXERCISE
| (a) | Of the 5 images you observed, which image was taken at the longest wavelength? |
| (b) | Of the 5 images you observed, which image was taken at the shortest wavelength? |
| (c) | Why do you think the object is not visible at X-Ray wavelengths? |
| (d) | Consider the maps that you created, in your opinion which map best describes the object? Explain your answer. |
|
|
|
|
| Previous | Up | Next |
2000-08-02