Flash event Matches found by 3 or more telescopes in May 2026
Use this link to compare times and frequencies of flashes detected by the horn radio telecopes
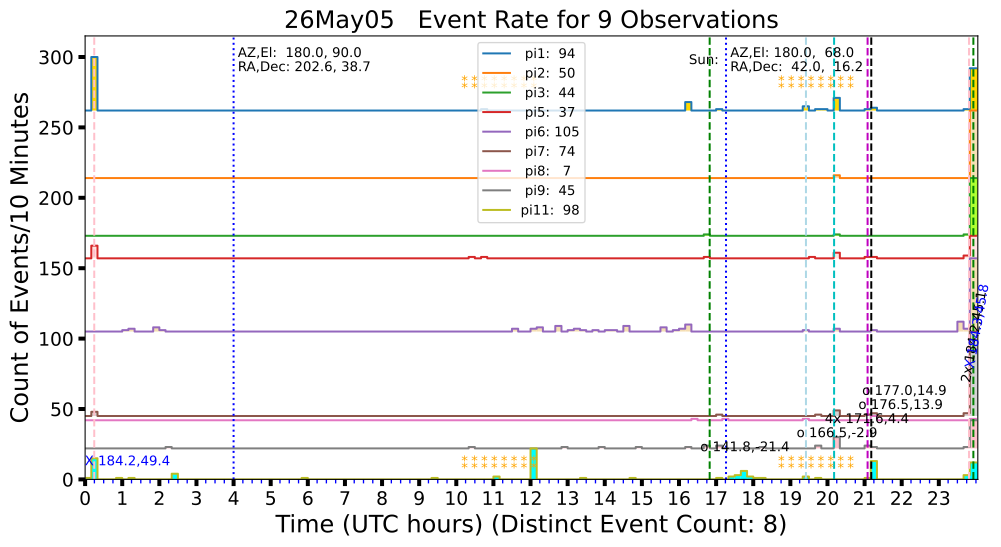
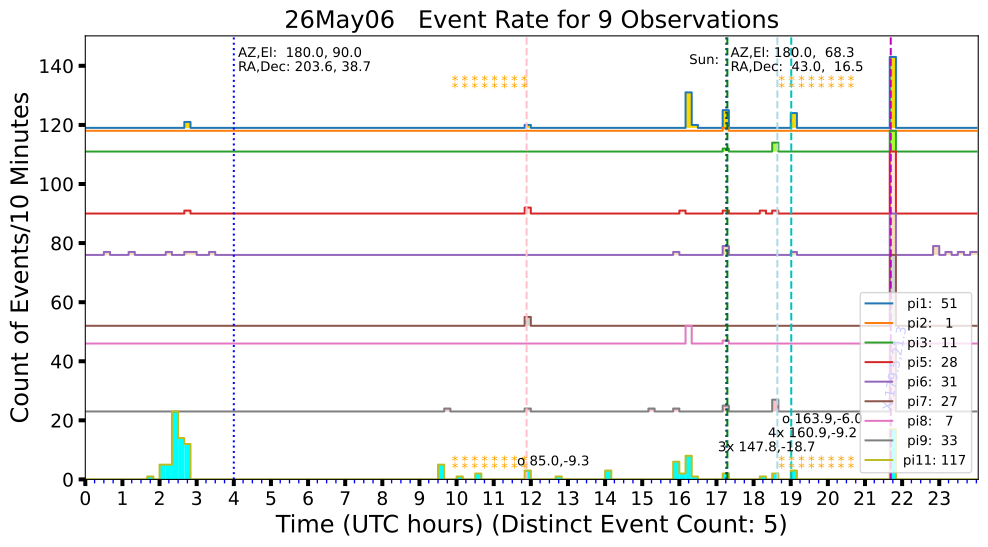
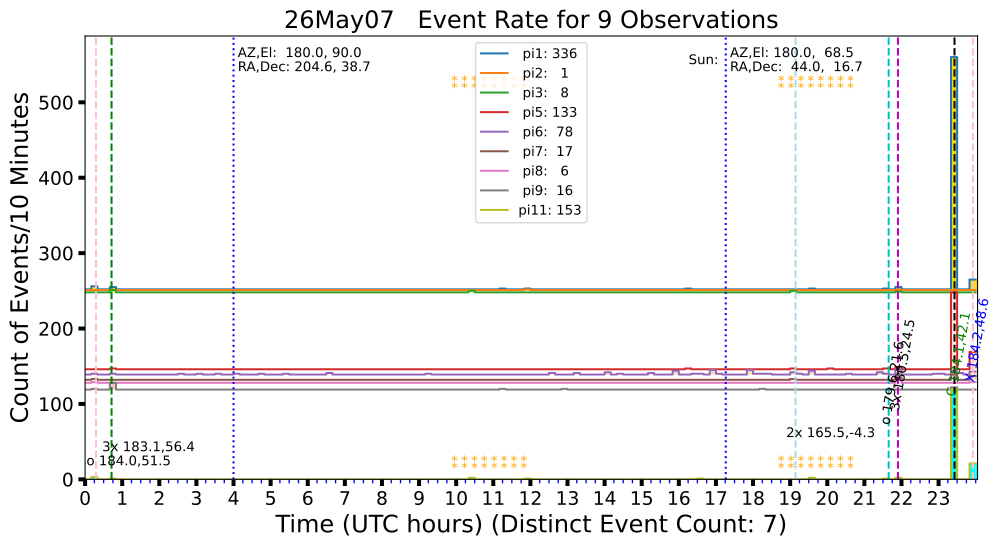
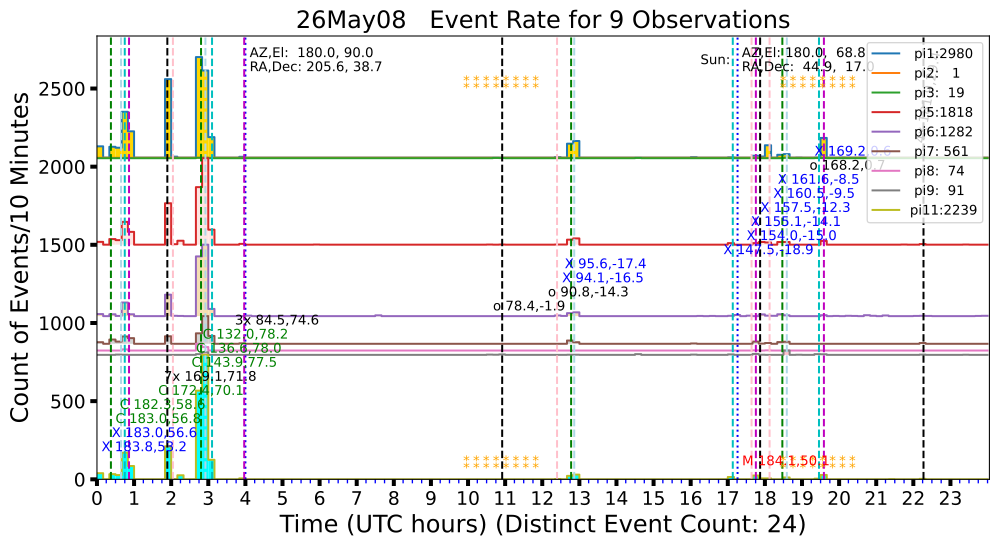
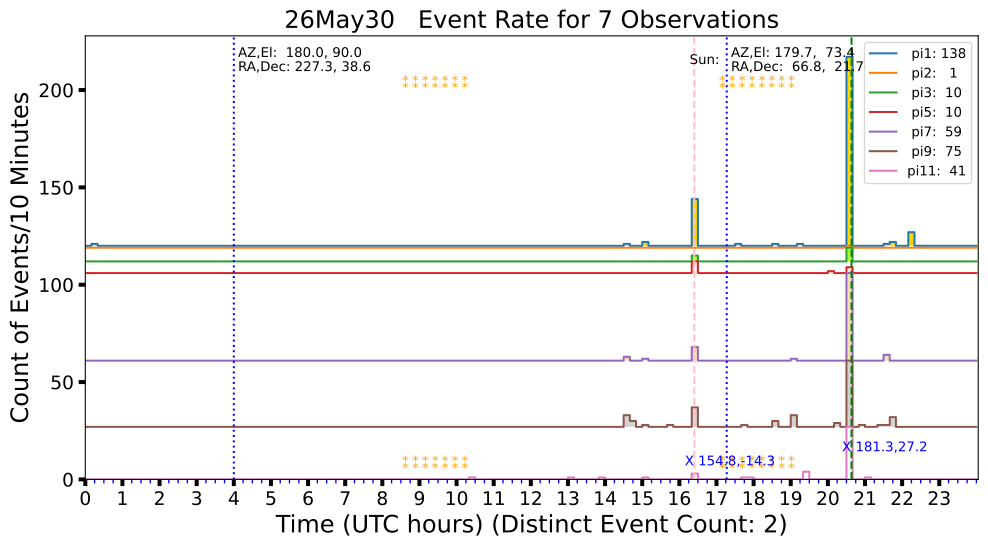
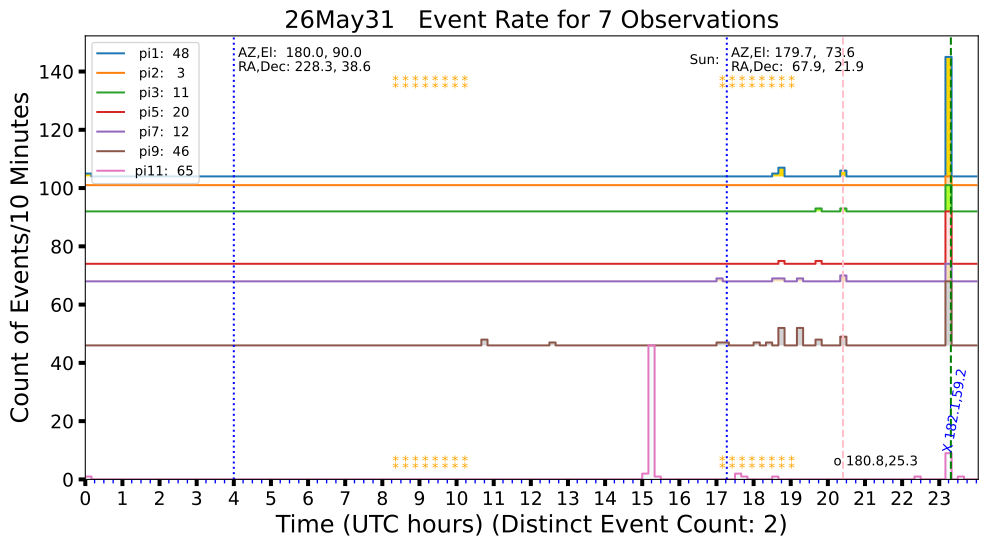
during this month of observations. The plots show the counts of flashes seen by each telescope over a 24 hour (UTC) interval. The X-axis is UTC time of day in hours. The Y-axis shows a histogram of the number of
flashes seen by a telescope in a 10-minute interval. The histograms are stacked so that the plot of the first telescope starts at zero. The histogram line for the next telescope starts at the maximum of the previous telescope. This allows the times of simultaneous flashes to be more easily seen.
An event is declared if three, or more, telescopes record flashes at the same time, to within +/- 0.5 seconds.
The times of matched events are shown as vertical lines. The histogram order is the same as the legend order. The legend shows the telescope number and the total number of flashes seen for that telescope on that day.
During May 2026, were pointed at 90 degrees elevation, straight up.
At this elevation the galactic plane passes within +/- 10 degrees of the horn telescope beam
about one quarter of the day. The times for viewing the galactic plane are marked as gold asterisks a t the bottom and top of the plot.
Links to Data and Plots of all Matched Flash Events
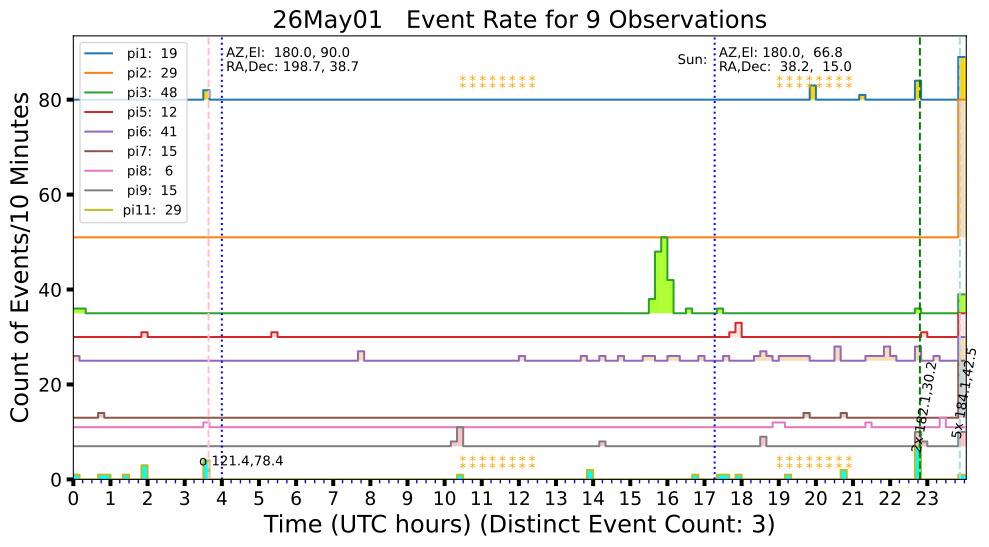 26May01
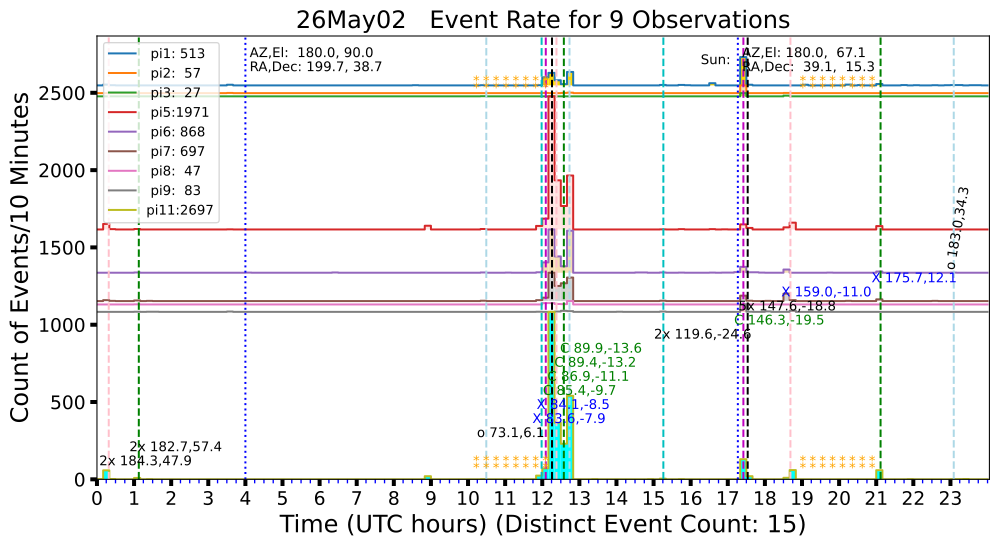 26May02
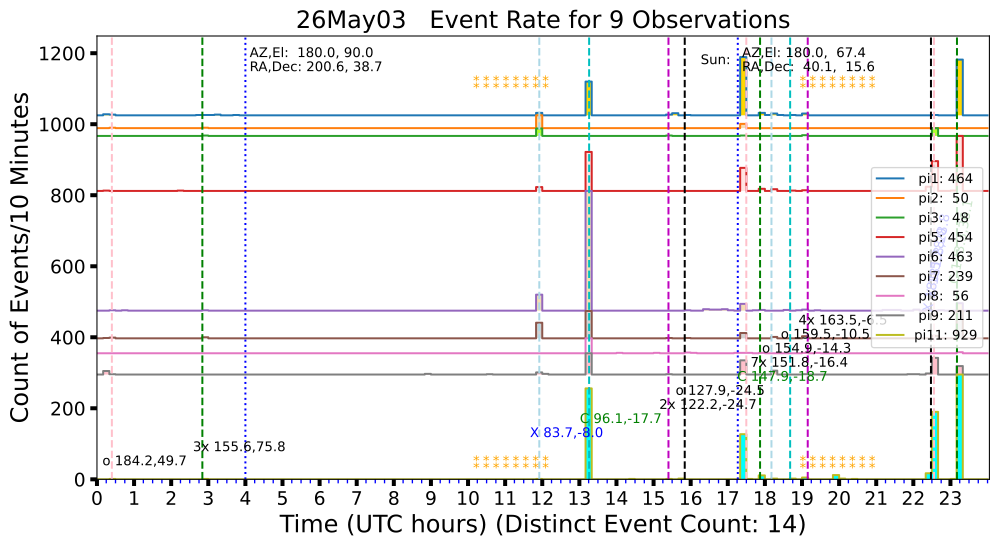 26May03
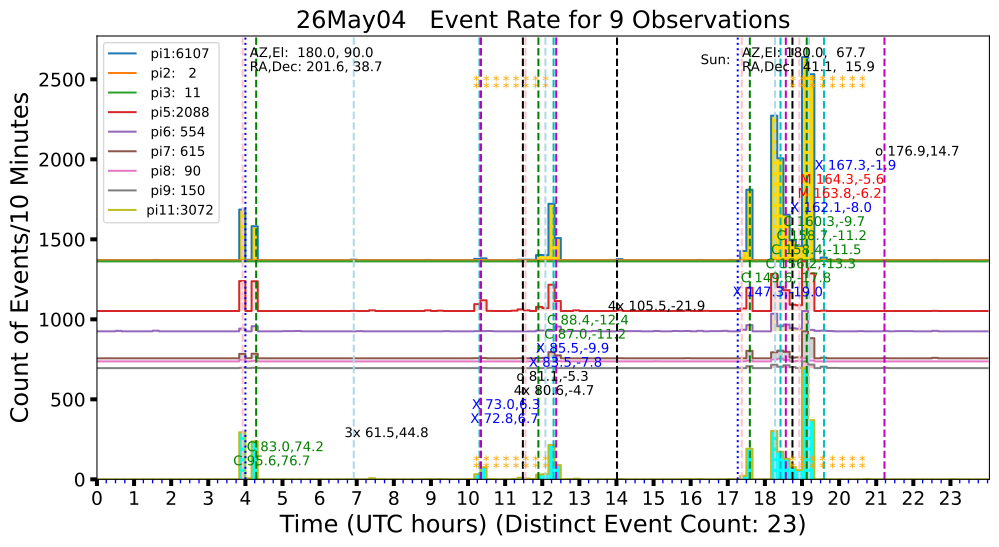 26May04
 26May05
 26May06
 26May07
 26May08
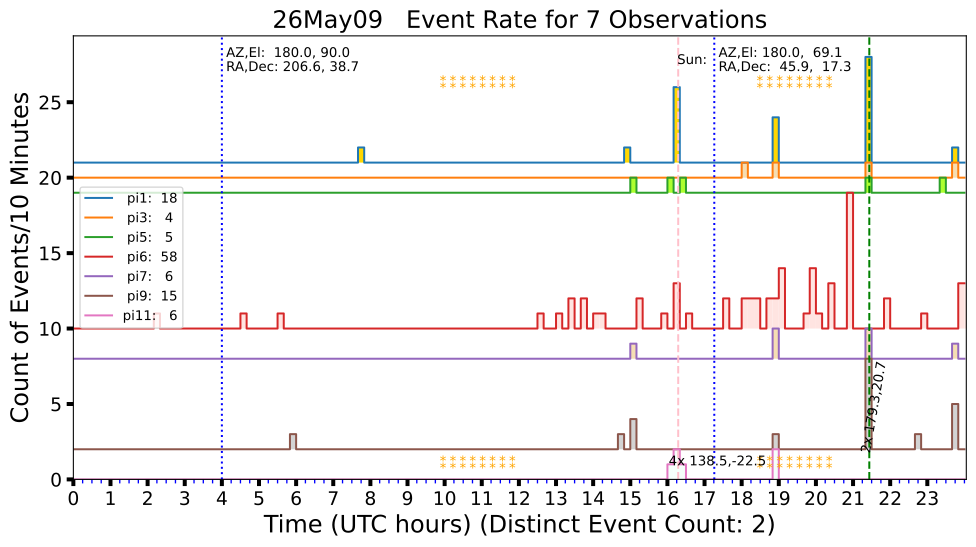 26May09
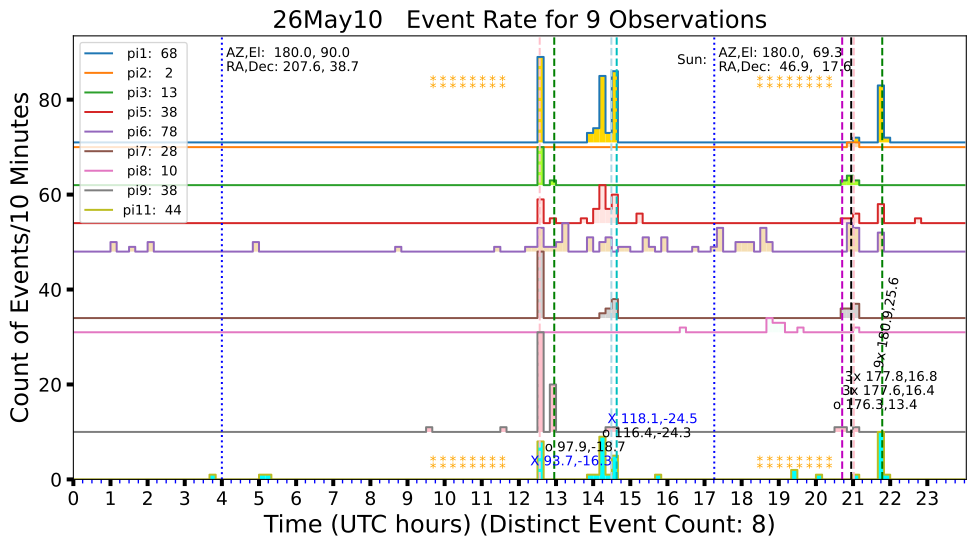 26May10
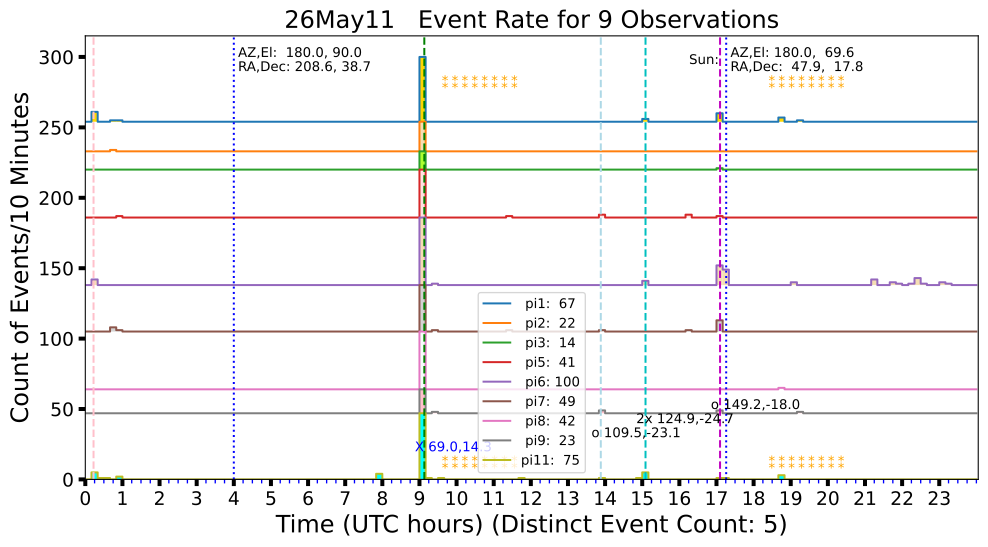 26May11
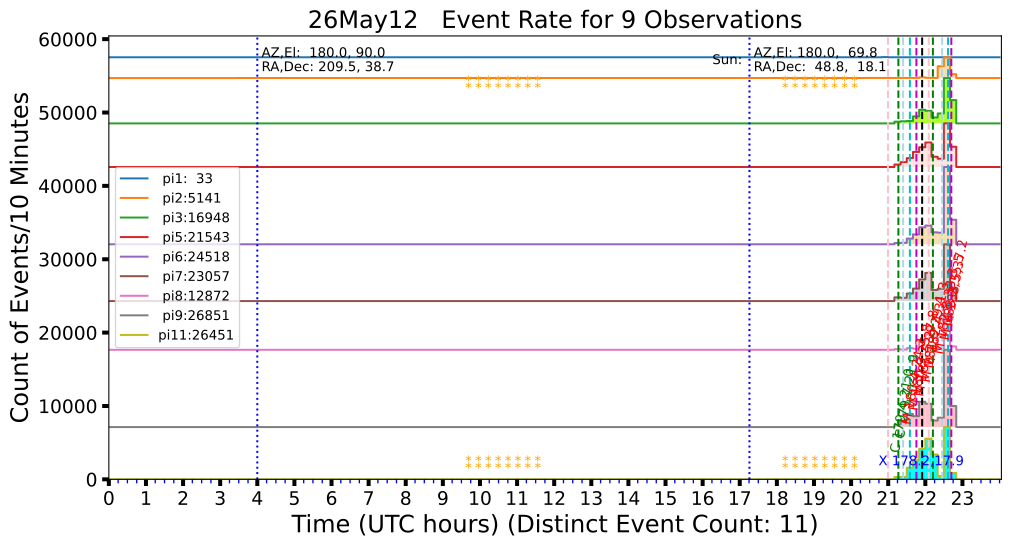 26May12
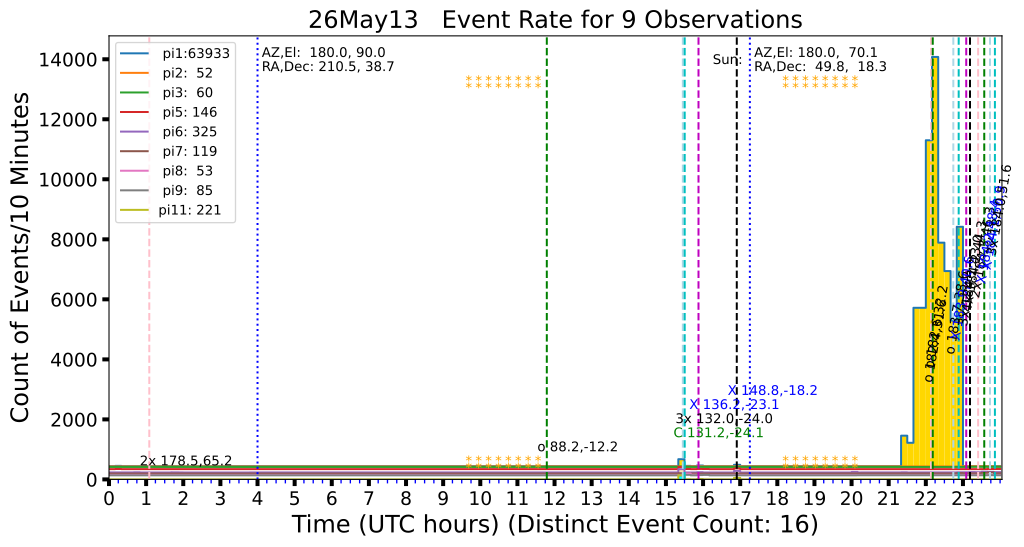 26May13
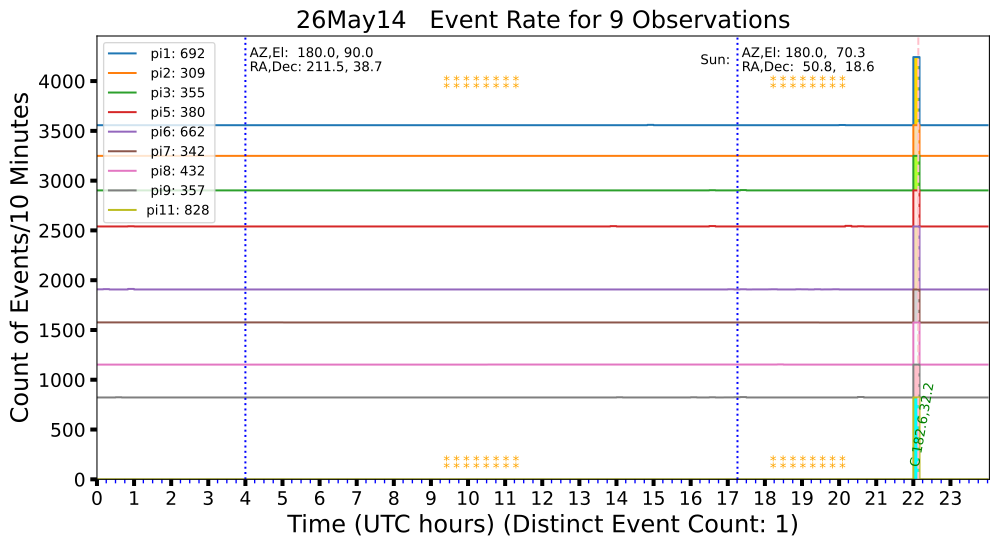 26May14
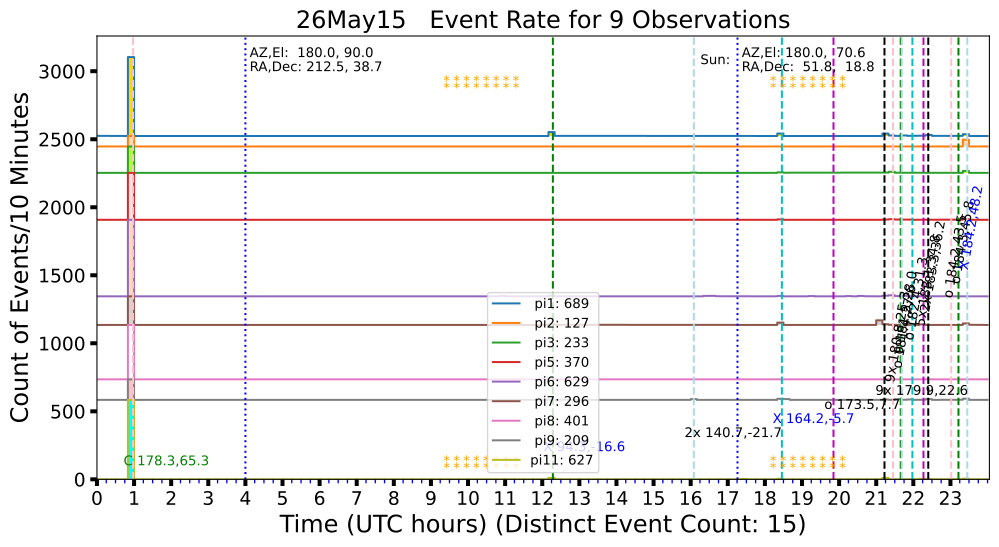 26May15
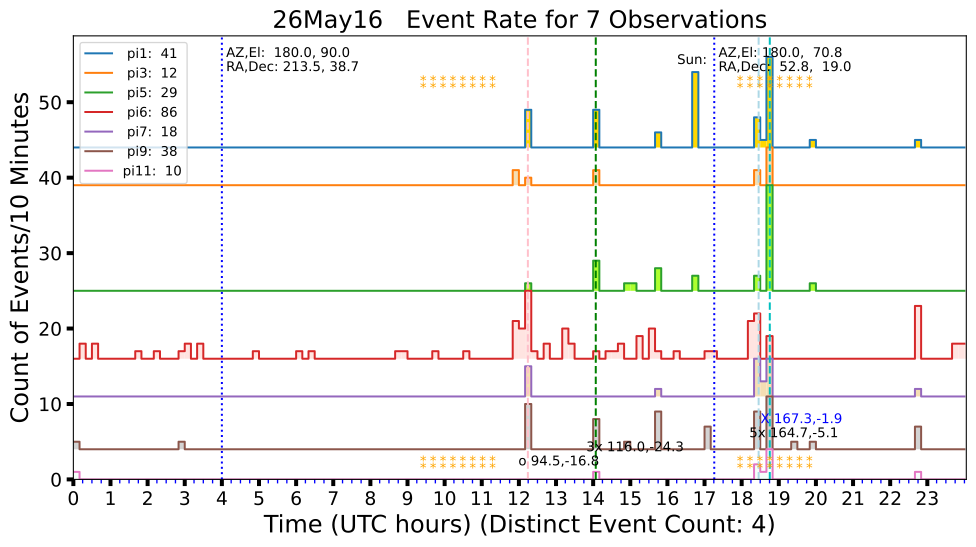 26May16
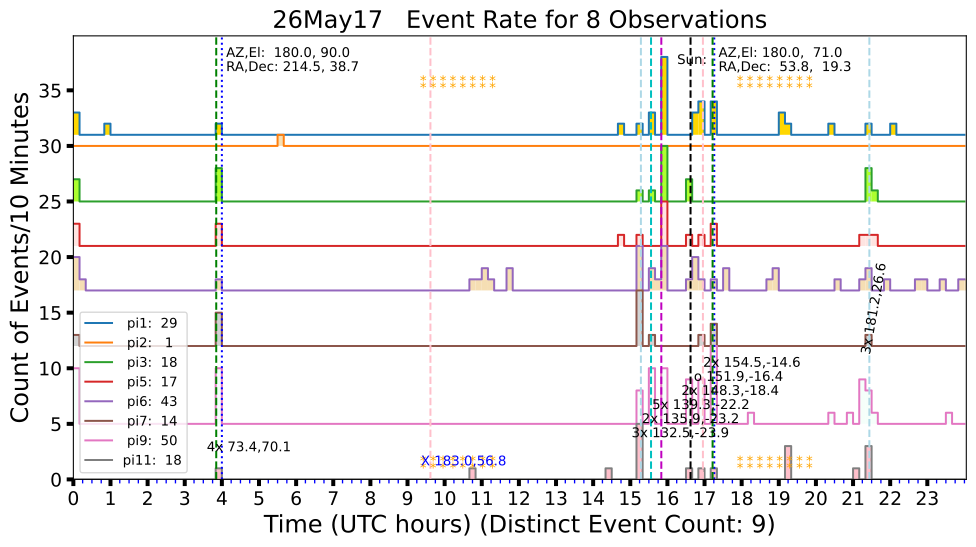 26May17
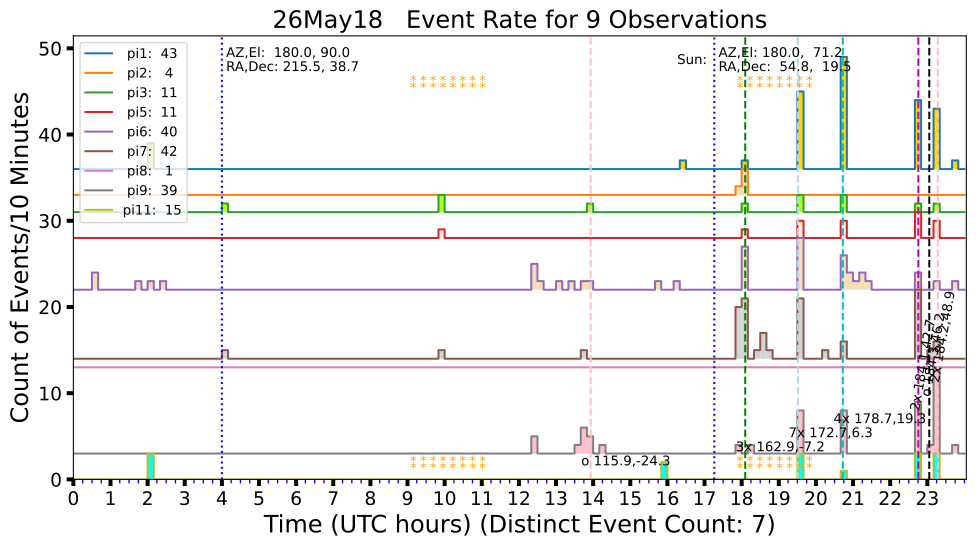 26May18
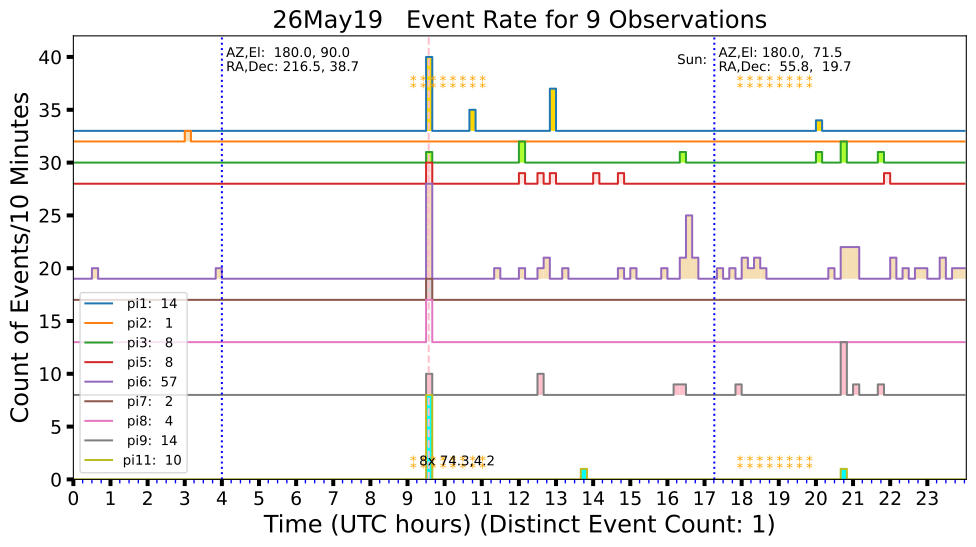 26May19
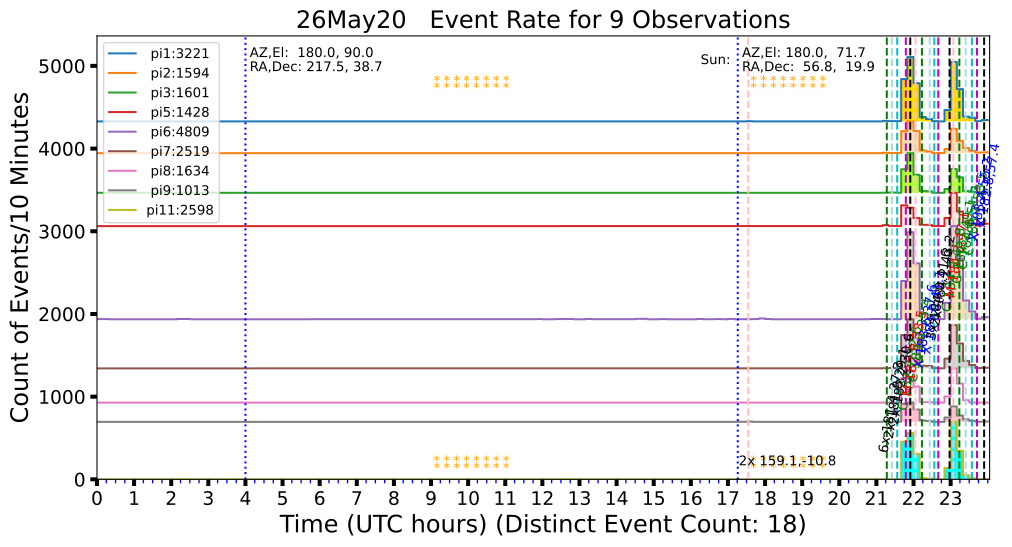 26May20
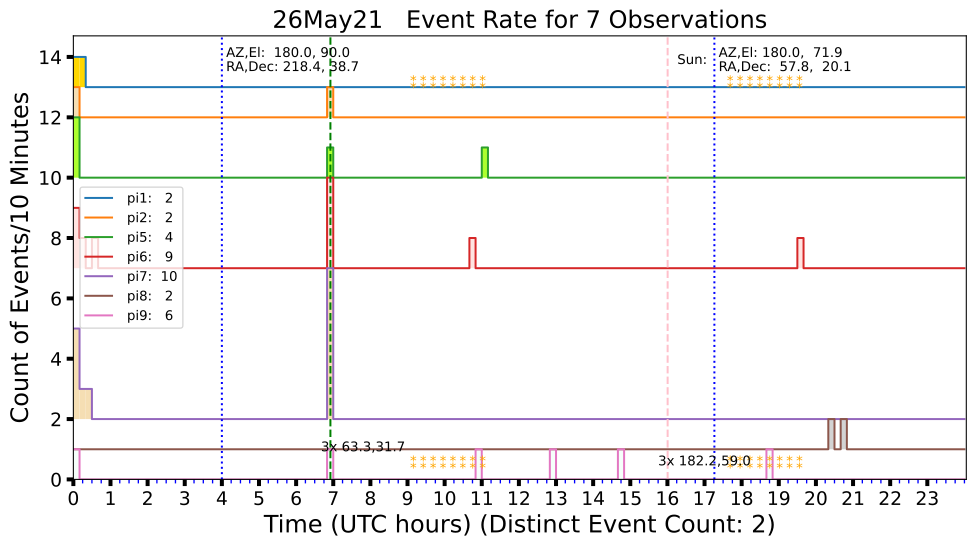 26May21
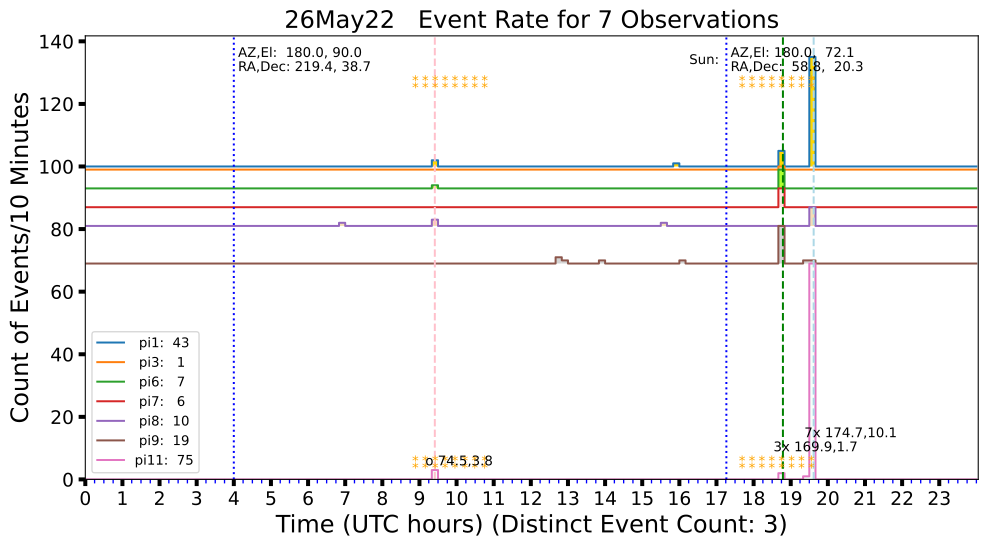 26May22
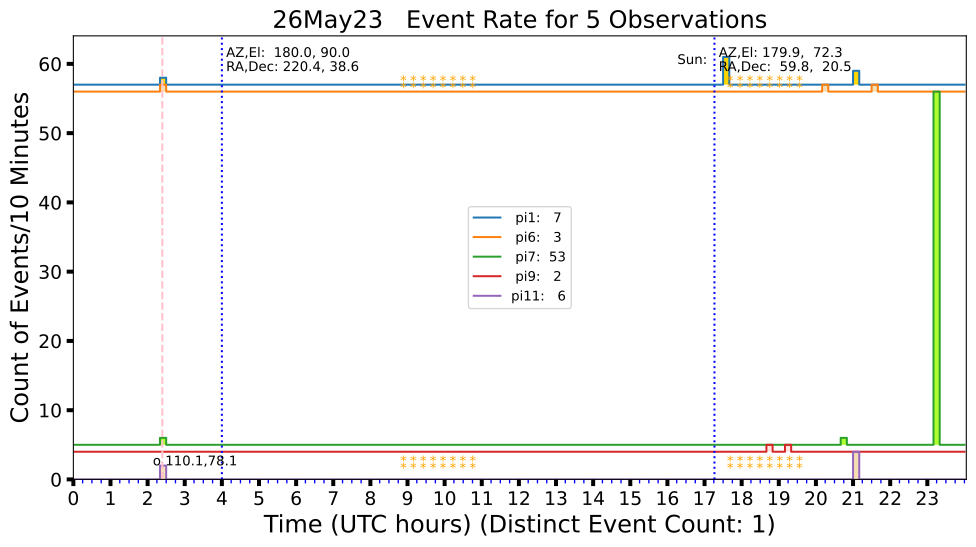 26May23
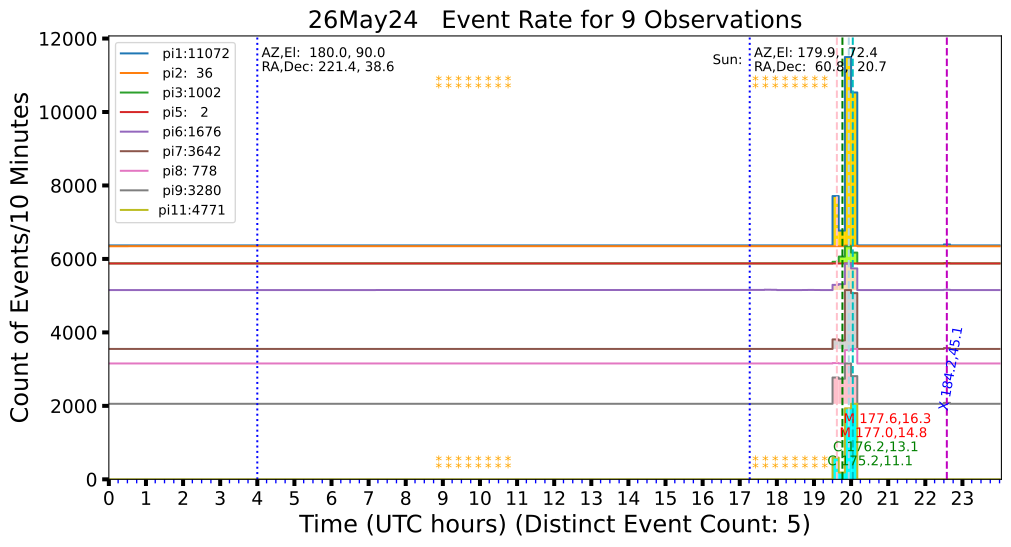 26May24
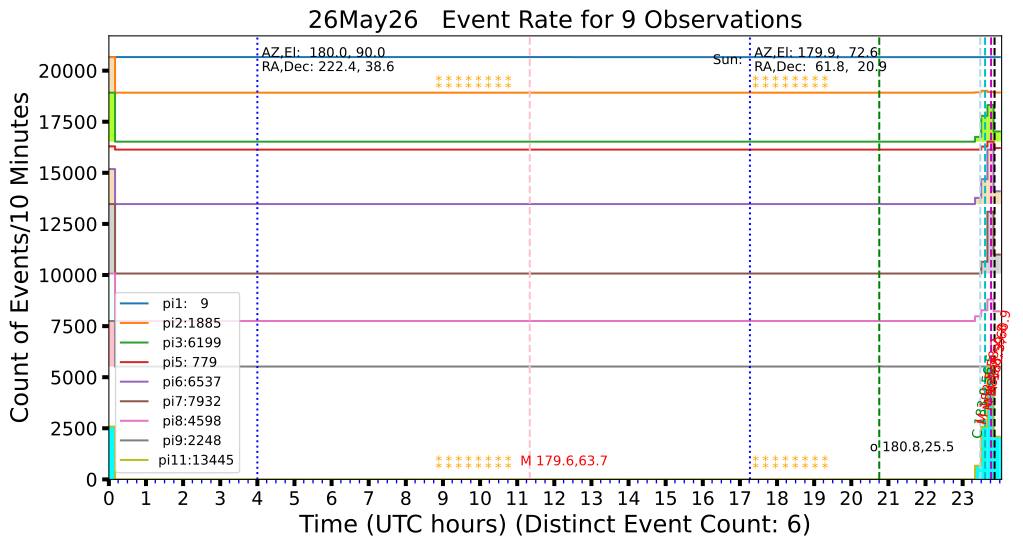 26May26
26May26
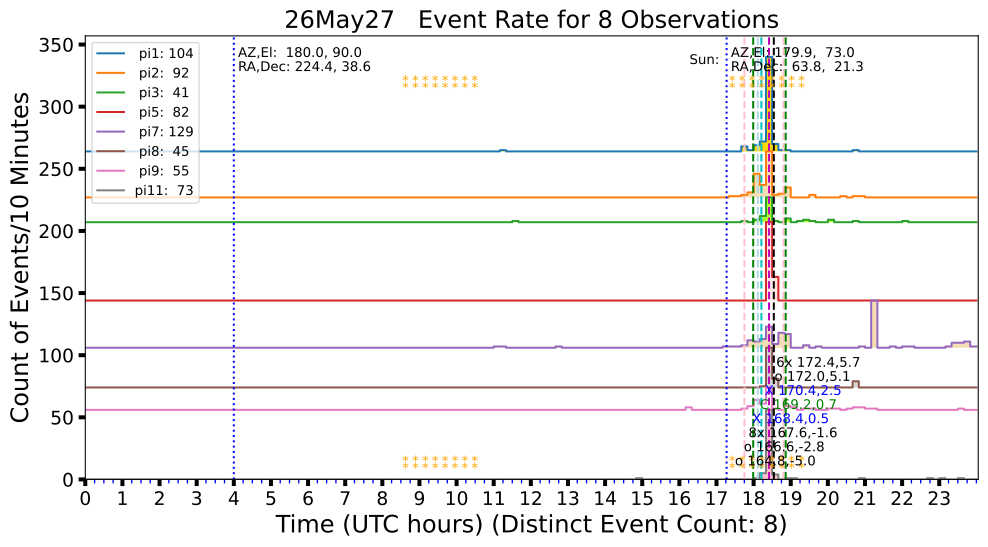 26May27
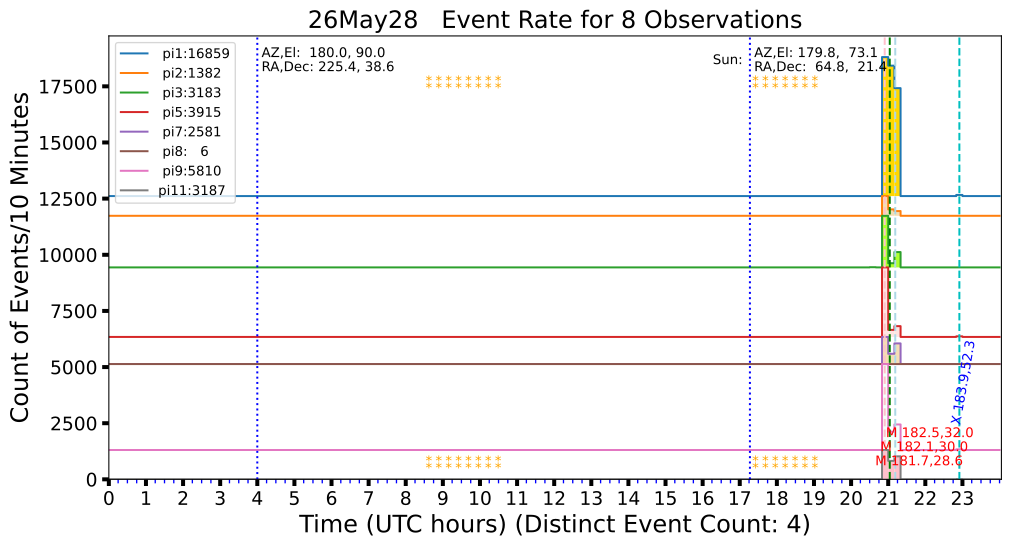 26May28
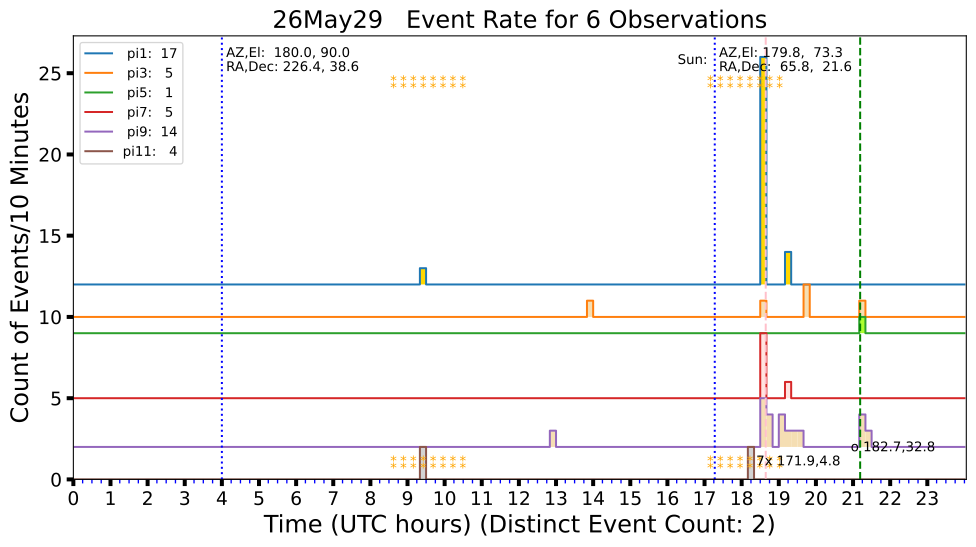 26May29
 26May30
 26May31