|
|
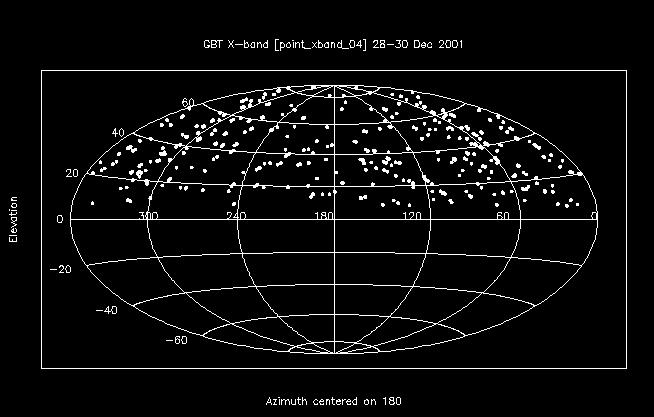
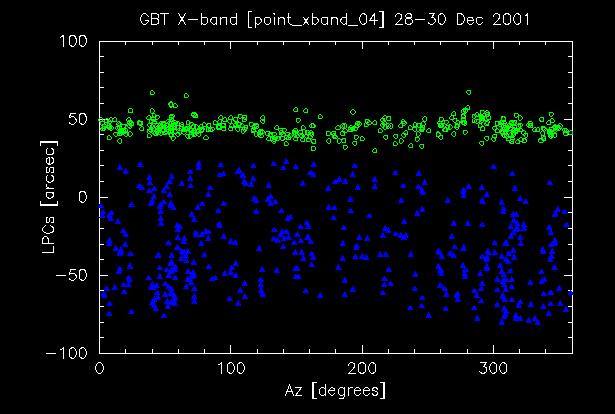
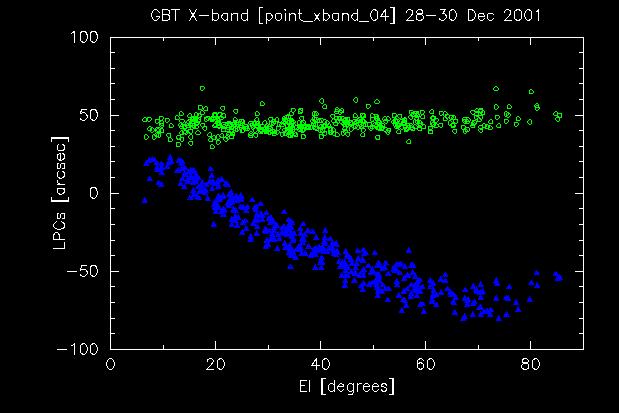
GBT X-band [point_xband_04] 28-30 Dec 2001
The all-sky pointing run was performed using the S-band pointing model
determined in 09-10 March 2001. The model for refraction was improved
and a new empirical focus tracking model was incorporated. Hence the
large residuals observed below. The blue triangles correspond to
residuals in elevation (Delta(E)), while the green circles corresond
to residuals horizontally on the sky (Delta(A)*Sin(E)).
The all sky pointing run Az-El coverage. (Postscript Version)
The residuals as a function of azimuth. (Postscript Version)
The residuals as a function of elevation. (Postscript Version)
The results were analyzed using the program TPOINT (Wallace 1998).
Eight physical terms were used. The determined coefficients are
listed below along with the correlation between terms. Plots of
various parameters follow.
Last modified: Sun Oct 27 20:46:01 EST 2002
* fit

       coeff       change     value    sigma

  1   & IA         -0.001    -14.18    4.927
  2   & IE         -0.000   +758.10    6.221
  3   & NPAE       -0.000     -4.71    4.456
  4   & CA         +0.001    -27.00    6.224
  5   & AW         +0.000     -2.18    0.421
  6   & AN         -0.000     -2.96    0.431
  7   & HZCZ       -0.000   +680.72    4.456
  8   & HZSZ       -0.000   +794.33    4.920

Sky RMS =   7.39
Popn SD =   7.46
* Correlations between terms:

IE       -0.0039
NPAE     +0.9398 -0.0011
CA       -0.9876 +0.0033 -0.9782
AW       +0.0459 -0.0587 +0.0116 -0.0397
AN       +0.0114 +0.0451 +0.0119 -0.0137 -0.0170
HZCZ     -0.0046 +0.9782 -0.0015 +0.0039 -0.0629 +0.0182
HZSZ     -0.0033 +0.9875 -0.0009 +0.0027 -0.0459 +0.0431 +0.9398

          IA      IE      NPAE    CA      AW      AN      HZCZ
Summary of TPOINT results. (Postscript Version)
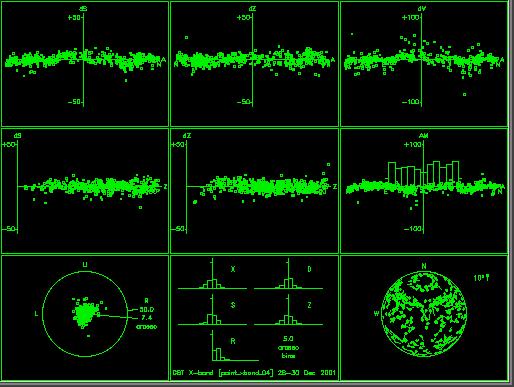
Residuals horizontally on the sky versus azimuth
Residuals in zenith angle versus azimuth
Residuals corresponding to Az/El non-perpendicularity versus azimuth
Residuals horizontally on the sky versus zenith angle
Residuals in zenith angle versus zenith angle
Residuals in azimuth axis misalignment
Scatter diagram of the pointing residuals
Distributions of the pointing residuals
|
|
|
|
|
|
|