Observations

Horizon Scans

Elevation Scans

Summary

Ku-Band RFI

Observations

On April 7-8, 2004 GBT project checkout observations were performed using the Ku-Band receiver. Serveral scans to identify RFI in the Ku-Band nominal receiver bandpass were made as part of these observations. The spectrometer was used for these observations. The spectrometer was setup to provide 800 MHz instantaneous bandwidth in two separate side-by-side bandpasses. The frequency were shifted and observations repeated in order to cover the entire receiver bandpass. The center frequencies used were 12.4, 13.1, 13.8, 14.5, 14.3 and 15.0 GHz.

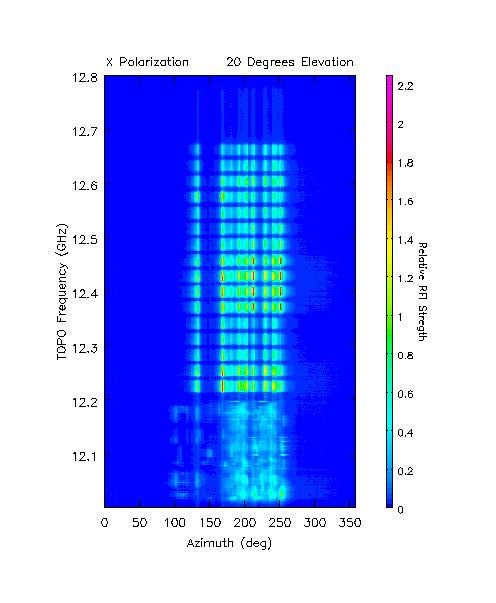
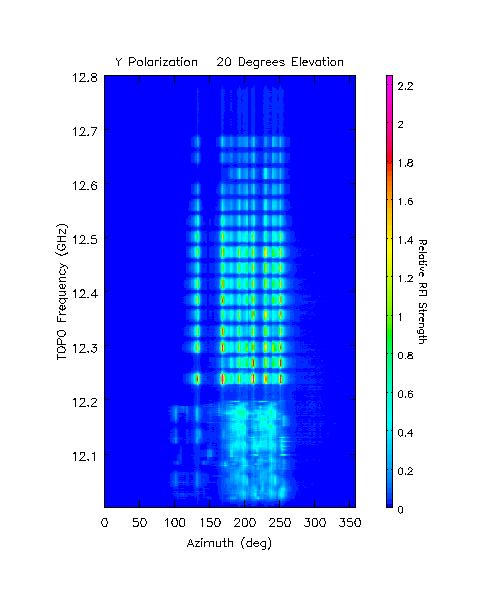
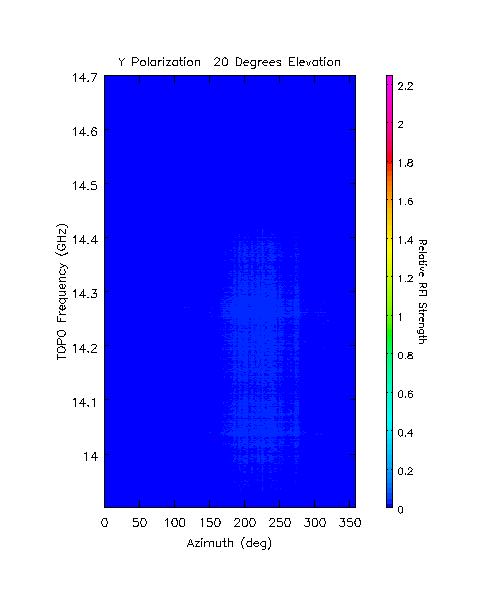
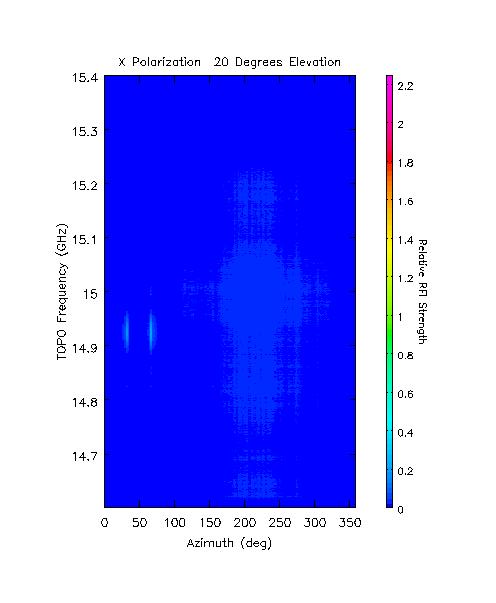
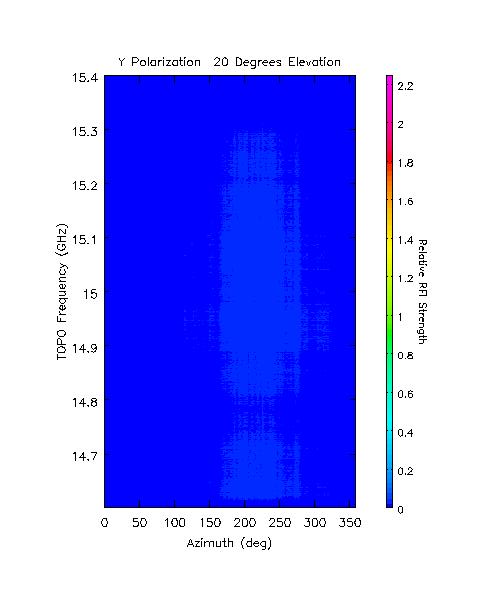
Horizon scans were taken where the GBT was moved from 0 degrees azimuth to 360 degrees azimuth at a constant elevation of 20 degrees. The telescope was slewed at 30 degrees per minute in azimuth and a 3 second integration time was used. The scans were made so that data at all frequencies within the receiver bandpass could be obtained.

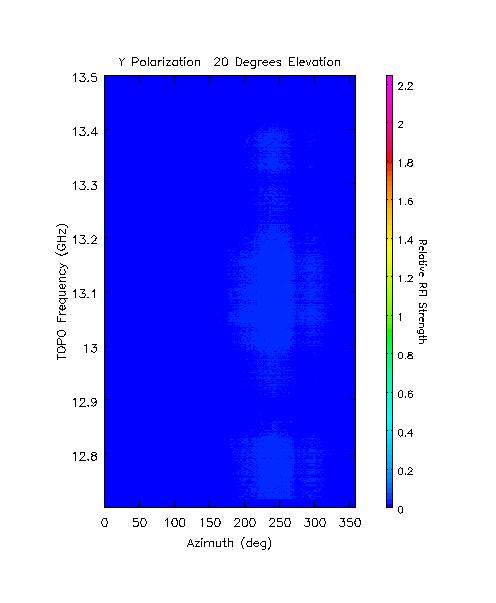
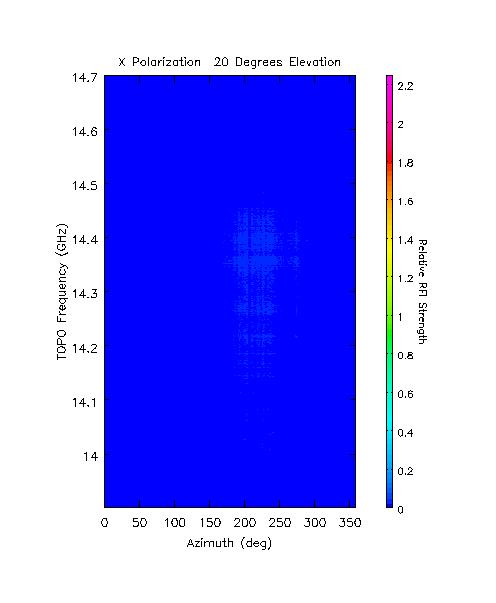
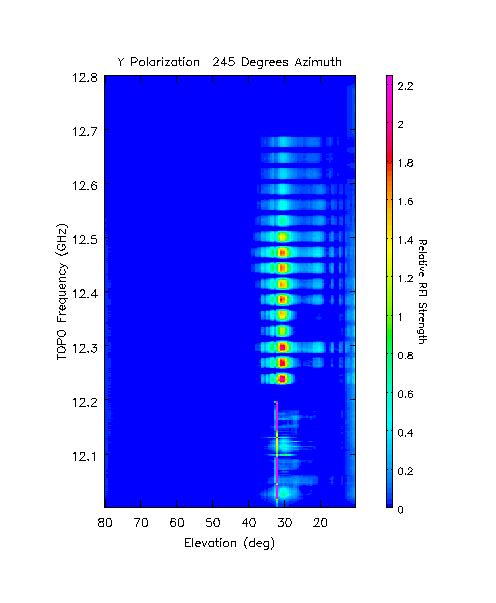
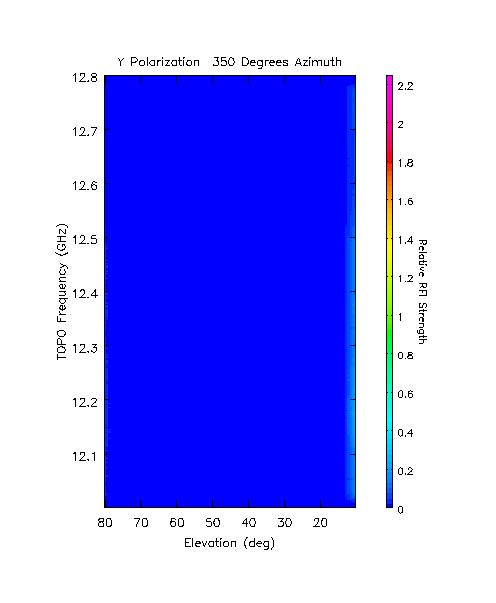
Elevations scans were taken were the GBT was moved between 10 degrees and 80 degrees elevation at three different azimuths. These were 180, 245, and 350 degrees azimuth. Data were only taken for the bandpasses centered on 12.4 and 13.1 GHz since no apparent RFI was present in the other bands (see below).

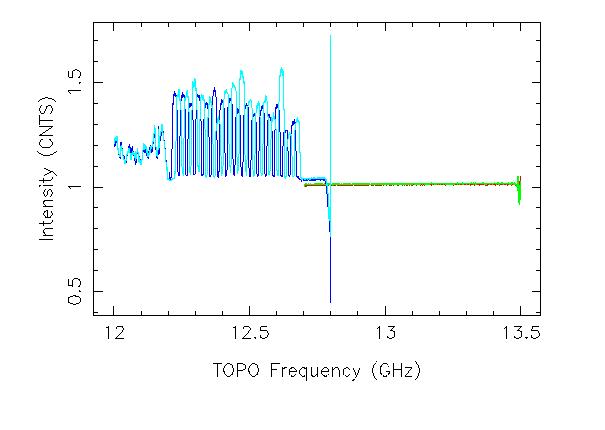
Several integrations within each scan that appeared to have no RFI were used to remove an interpolated "baseline" from the data. This allows us to easily visulize were the RFI is present. I have not attempted to calibrate the data.

Horizon Scans

Figure 1 Click on image for postscript version. X (left) and Y (right) polarizations. 800 MHz bandwidth centered on 12.4 GHz.


Figure 2 Click on image for postscript version. X (left) and Y (right) polarizations. 800 MHz bandwidth centered on 13.1 GHz.


Figure 3 Click on image for postscript version. X (left) and Y (right) polarizations. 800 MHz bandwidth centered on 13.8 GHz.


Figure 4 Click on image for postscript version. X (left) and Y (right) polarizations. 800 MHz bandwidth centered on 14.3 GHz.


Figure 5 Click on image for postscript version. X (left) and Y (right) polarizations. 800 MHz bandwidth centered on 14.5 GHz.


Figure 6 Click on image for postscript version. X (left) and Y (right) polarizations. 800 MHz bandwidth centered on 15.0 GHz.


Elevation Scans

Figure 7 Click on image for postscript version. 180 degrees Azimuth. X (left) and Y (right) polarizations. 800 MHz bandwidth centered on 12.4 GHz.


Figure 8 Click on image for postscript version. 180 degrees Azimuth. X (left) and Y (right) polarizations. 800 MHz bandwidth centered on 13.1 GHz.


Figure 9 Click on image for postscript version. 245 degrees Azimuth. X (left) and Y (right) polarizations. 800 MHz bandwidth centered on 12.4 GHz.


Figure 10 Click on image for postscript version. 245 degrees Azimuth. X (left) and Y (right) polarizations. 800 MHz bandwidth centered on 13.1 GHz.


Figure 11 Click on image for postscript version. 350 degrees Azimuth. X (left) and Y (right) polarizations. 800 MHz bandwidth centered on 12.4 GHz.


Figure 12 Click on image for postscript version. 350 degrees Azimuth. X (left) and Y (right) polarizations. 800 MHz bandwidth centered on 13.1 GHz.


Summary

RFI is present at all frequencies below about 12.7 GHz. This RFI is from satellite TV transmissions. The RFI is present between 90 and 270 degrees azimuth and elevations below about 40 degrees.

Figure 13 Click on image for postscript version. A typical spectrum in the region where the satellite TV transmissions are observed. Both X and Y polarizations are shown.


Last modified: Thu Jul 1 08:07:28 EDT 2004