Baselines
Typical baseline structures can removed by performing ON/OFF observations
(position switching)
and then reducing the data using
ON - OFF
---------------
OFF
A typical example
for the case where there is only weak continuum emission from the target
source is shown in Figure 1. These
baselines are usually suitable for spectral line observations.
 |
|
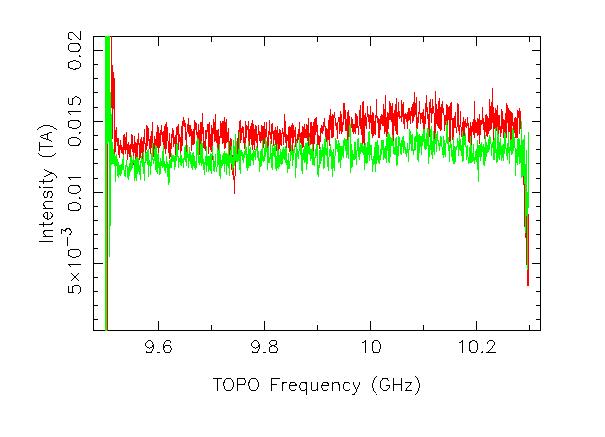
Figure 1. Baselines obtained for a weak continuum source
using (ON - OFF)/OFF data reduction. Note the "receiver suck-out"
at about 9.744 GHz in RCP. Click on image for postscript version.
|
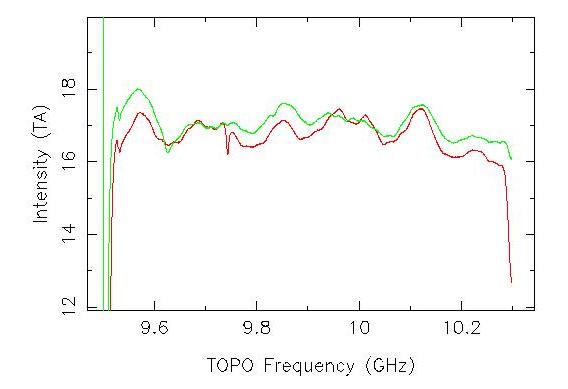
Strong continuum emission, however, excites the appearance of
baseline ripples in
the GBT IF system. A typical example is shown in Figure 2. In order
to achieve good baselines for wide spectral lines towards sources with
strong continuum emission a different data reduction technique is needed.
 |
|
Figure 2. Baselines obtained for a strong continuum source
using (ON - OFF)/OFF data reduction. Note the "receiver suck-out"
at about 9.744 GHz in RCP. Click on image for postscript version.
|
October 13, 2003 Observations
On October 13, 2003 test observations were done using NGC 7027 as the
target source and 2022+422 as the calibration source. Two separate
double position switch observations were done with the only difference
being that the LO1 value was changed by 58.59375 MHz (150 channels
in the resulting spectra). The results are shown in Figures 3 and 4.
 |
|
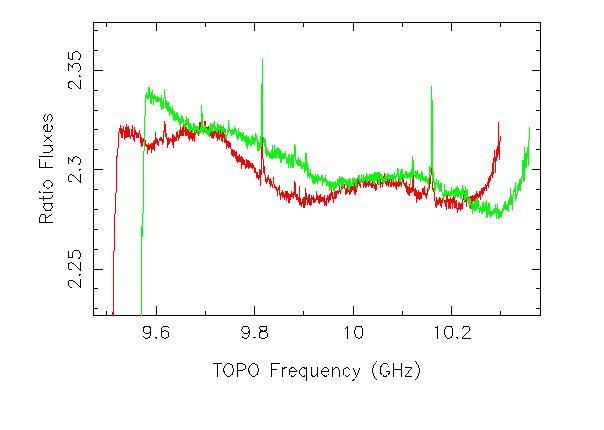
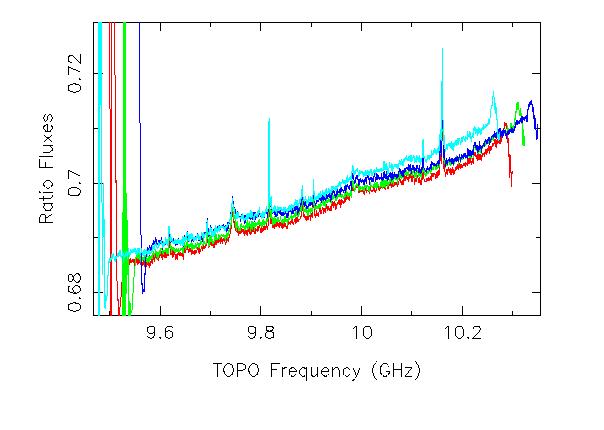
Figure 3. Baselines obtained through double position switching.
Only one polarization is shown. The only difference between the
two observations is that the LO1 frequency was changed by 58.59375
MHz (150 pixels). Note that the slope of these spectra are just
due to the difference in the spectral indices between the two sources.
Click on image for postscript version.
|
 |
|
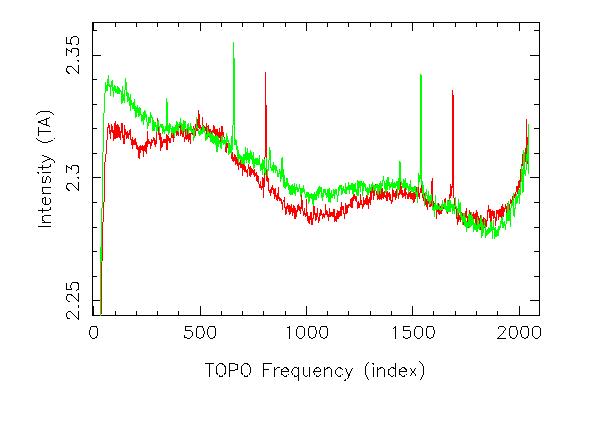
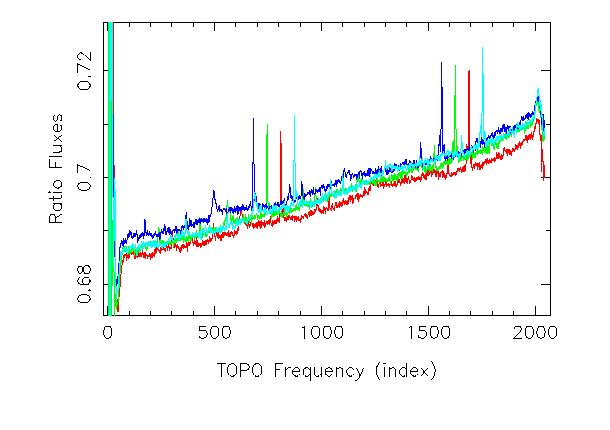
Figure 4. Same as Figure 3 but plotted against spectrum channel
number (index) instead of against frequency. Click on image for postscript version.
|
Although the double position switching improves the baselines it is
obvious that there still is substantial baseline structure present.
As can be seen from Figures 3 and 4 the dominant baseline structure moves in
frequency but not in spectrometer channel (index) number. This indicates
that the baseline structure is originating in the IF system after
(downstream) the LO1 mixer.
March 27, 2004 Observations
On March 27, 2004 test observations were done using NGC 7027 as the
target source and 3C 454.3 as the calibration source. A single
double position switch observation was done where four separate
LO2 values were used to produce four spectra. The LO2 values
were stepped at 25 MHz intervals. All data in each spectra result
from data coming down the same optical fiber.
The results are shown in Figures 5 and 6.
 |
|
Figure 5. Baselines obtained through double position switching.
Only one polarization is shown. The only difference between the
spectra is that different values of LO2 have been used. The spectra
were produced simultaneously from the same data stream from a
single optical
fiber. Click on image for postscript version.
|
 |
|
Figure 6. Same as Figure 5 but plotted against spectrum channel
number instead of against frequency. Click on image for postscript version.
|
As can be seen from Figures 5 and 6 the dominant baseline structure moves in
spectrometer channel (index) number but not in frequency. This indicates
that the baseline structure is originating in the IF system before
(upstream) the LO2 mixers.
Isolating Continuum Baseline Structure Sources
The October 2003 and March 2004 results indicate that the dominant
baseline structure for the double position switch observations
arise somewhere between (and including) the LO1 mixer and the LO2 mixer.
The baseline ripples have scales on the order of 50 to 100 MHz. This
indicates they possibly arise from standing waves of the order of
3 to 6 meters in length.
The IF path between the LO1 and LO2 mixers is as follows for each
polarization. After the LO1 mixer the signal goes through an IF Filter
and is then amplified. Next the signal goes through a splitter
so the the same signal can be sent to several different IF Rack
modules. Before being put onto fiber the signal goes through
an IF switch that determines which of two optical fibers the
signal will go down. The signal then proceeds through a variable
attenuator, an IF Filter and then is modulated onto the optical
fiber via a modem. The signal is then received via another modem
in the Converter Rack and mixed with the LO2. (See Figures 7, 8 and 9.)
 |
|
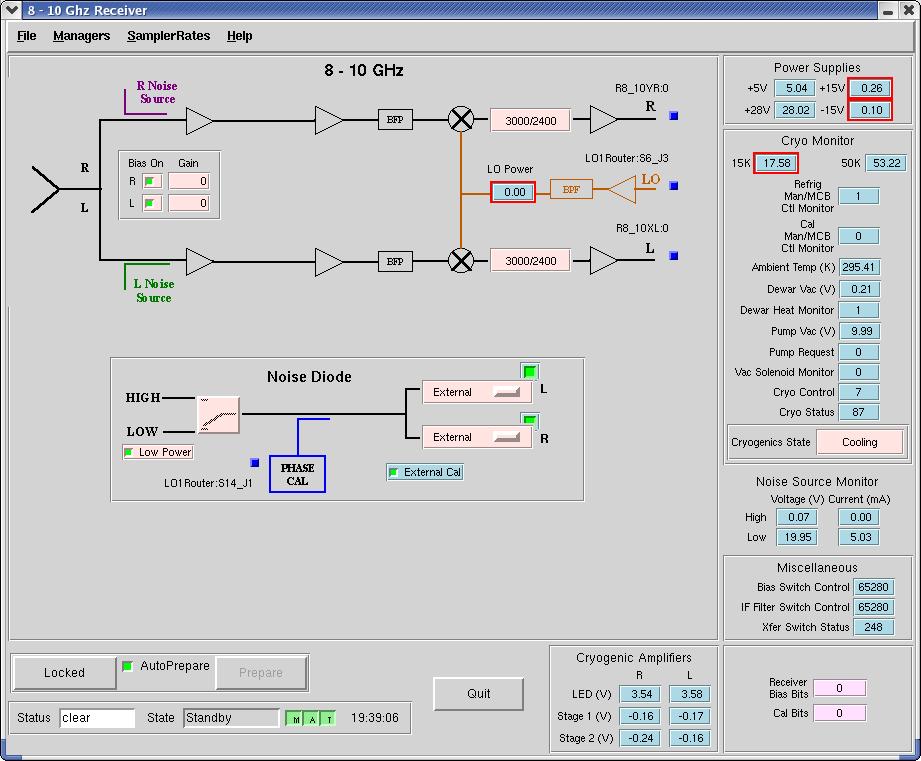
Figure 7. The X-band receiver IF path. Click on image to see
full size.
|
 |
|
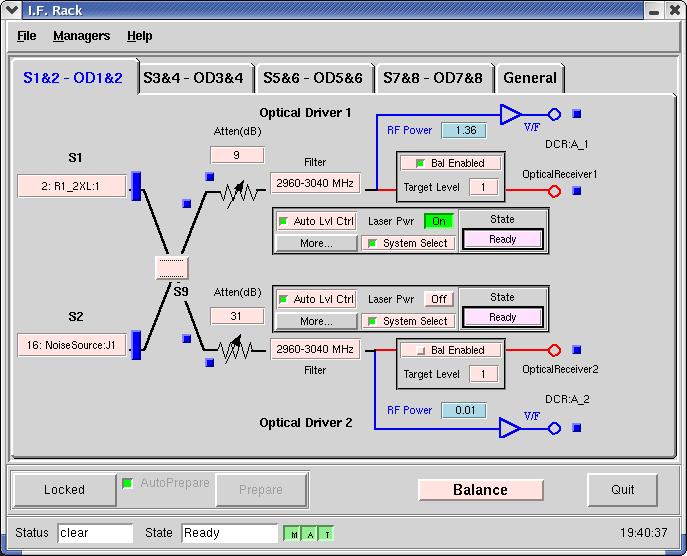
Figure 8. The IF Rack IF path. Click on image to see
full size.
|
 |
|
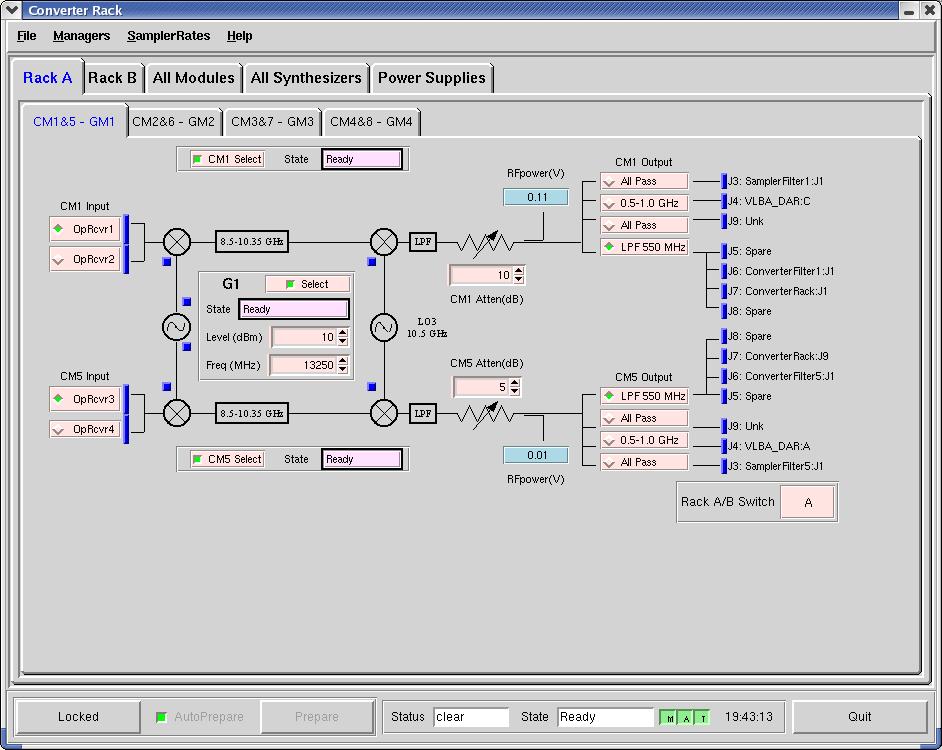
Figure 9. The Converter Rack IF path. Click on image to see
full size.
|
Future Tests
Test 1
In the March, 2004 tests only a single optical fiber was used to
produce the four separate spectra. However, using two different
fibers to produce the different spectra would tell us if the
baseline structure arises in the optical fibers. If the baselines
look the same then it suggests that the baselines arise before the
signal goes onto the optical fibers. (We can probably already
rule out the LO2 synthesizers since the four different synthesizers
used in the March, 2004 tests produced nearly identical baselines -
see Figure 5). If the baselines are different then it would suggest
that the optical fibers could be the culprit.
Test 2
Vary the IF Rack attenuation to see if that affects baseline ripples.
Test 3
Vary the IF Rack filter between "All Pass" and "2360-3640 MHz"
to see if that affects baseline ripples.
Test 4
Remove the IF splitter before the optical drivers or terminate the
unused outputs of the IF splitter to see if the
baseline ripples come from reflections off of the splitter.
