High Frequency Weather Forecasts
Last updated: Tue, Apr 23, 10:00:00 UT
Ronald J Maddalena (Retired) and Larry Morgan
Green Bank Observatory, Green Bank, WV
Overview
of DSS Observing Efficiencies Limits:
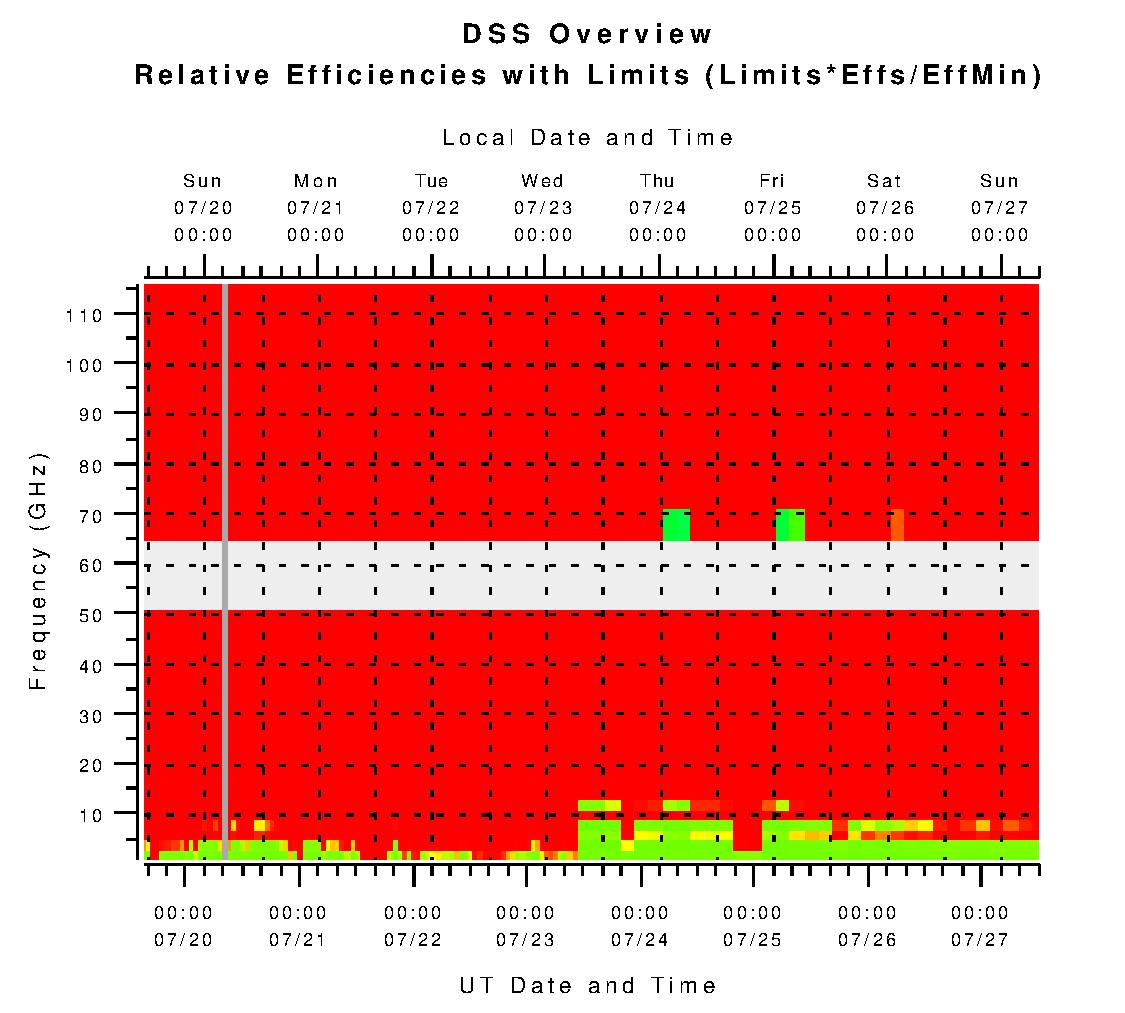
 The color coding in
the plot uses green through blues to indicate times and frequencies
where the Dynamic Scheduling
System
(DSS) will most likely schedule projects. Yellows through red are
those frequencies and times when the DSS believes would be an
unproductive use of the telescope. A light blue background
indicates frequencies which are not yet covered by the DSS algorithms
or are times for
which there are no forecasted values. The blue vertical line
indicates the time when this plot
was last updated, usually within the last two hours. The DSS
algorithms apply to forecasted opacities for Hot Springs, VA only.
The color coding in
the plot uses green through blues to indicate times and frequencies
where the Dynamic Scheduling
System
(DSS) will most likely schedule projects. Yellows through red are
those frequencies and times when the DSS believes would be an
unproductive use of the telescope. A light blue background
indicates frequencies which are not yet covered by the DSS algorithms
or are times for
which there are no forecasted values. The blue vertical line
indicates the time when this plot
was last updated, usually within the last two hours. The DSS
algorithms apply to forecasted opacities for Hot Springs, VA only.
The plot is derived
from the algorithms in DSS memo 5.3 (J. J. Condon & D. S. Balser, Dynamic
Scheduling Algorithms, Metrics, and Simulations,
2007), with modifications that reflect what actually was implemented in
the deployed software systems, plus the addendum for 84-90 GHz located
in the Software
Project Request 23Q110.
Unlike the old style plot below, the affects of winds and opacities are
not depicted separately. Instead, the algorithms calculate the
product of efficiencies for the current atmospheric condition, for
tracking errors from winds, and for the expected deformations of the
dish during daytime hours. A 'typical' elevation of 30º was used
in the calculation of the atmospheric efficiency. The forecasted
winds used in the calculation of tracking efficiency are altered by the
algorithms in DSS memo 6.2 (Dana S. Balser, Forecasting
the Wind Speed in Green Bank, 2010).
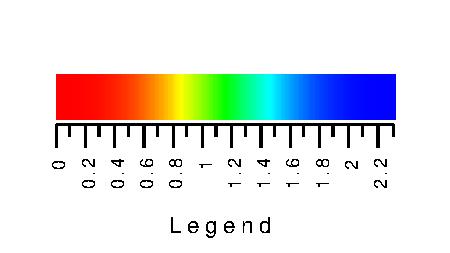
The color hue of of
the plot depicts H=eta*leff/etamin, where eta is the
product of the above-mentioned three
efficiencies (eq. 2 in Condon & Balser, 2007), etamin is the frequency
dependent minimum efficiency chosen by the DSS (eq. 23), and leff is a cutoff observing
efficiency limit (eq. 24). The DSS algorithms will most likely
schedule a project whenever H>1 (greens
through blues). Likewise, wherever H<1
(yellows through reds), the DSS will be more reluctant to schedule a
project. Since leff is a rather sharp
function, you may also want to examine a graph of eta/etamin.
You may also want to take a look at: