The Analog Filter Rack
consists of eight 1.6 GHz Sampler/Filter modules, sixteen 100 MHz
Converter/Filter modules and some supporting modules that provide power
and reference frequencies derived from the master hydrogen maser in the
GB
Site Timing Center. The filter modules are fed
from the sixteen 1-8 GHz Converter modules in Converter
Racks A and B. The 1.6
GHz Sampler modules choose from one of two 1-8 GHz Converter module
outputs or one of two inputs designed for future use and filter the signal
to an 800-1600 MHz range, an 800-1000 MHz range or ranges set by one of
two other possible filters, one via external rear panel connections, the
other installed inside the module. Each of the sixteen 100 MHz
Converters takes an output from one of the sixteen 1-8 GHz Converter
modules, down converts the signal to a 15-350 MHz range and filters to
50-100 MHz range, a 25-38 MHz range, an externally added filter range or a
range set by a future digital filter that will follow the 25-38 MHz
filter. All Sampler and Converter modules in the Filter Rack send an
RF output to the sampler section of the Spectrometer,
all eight Sampler modules and eight of the sixteen 100 MHz Converter
modules send a frequency stream proportional to the RF power level
detected at the output of each of the modules to the Digital
Continuum Receiver via optical fiber. The RF
power level is determined by coupling the signal to a square law
detector. That detected voltage is indicated on the Filter Module
CLEO pages under 'SG Power (V)' or 'CF Power (V)', on meters on the front
panel of each filter module and sent to a voltage to frequency converter
to generate the proportional frequency stream for the DCR.
Each RF detector is measured to determine its individual voltage versus
power characteristics and the data from those measurements is available
here.
Initial CLEO Analog Filter Rack Screen:
The initial CLEO Analog Filter Rack screen has the Menu
Bar common to most CLEO screens, three tabs that access
the Converter tabs, 1.6 GHz Sampler tabs and the Power Supplies tab.
At the bottom of the screen is a Quit button and the State/Status
frame common to CLEO device and manager
screens.
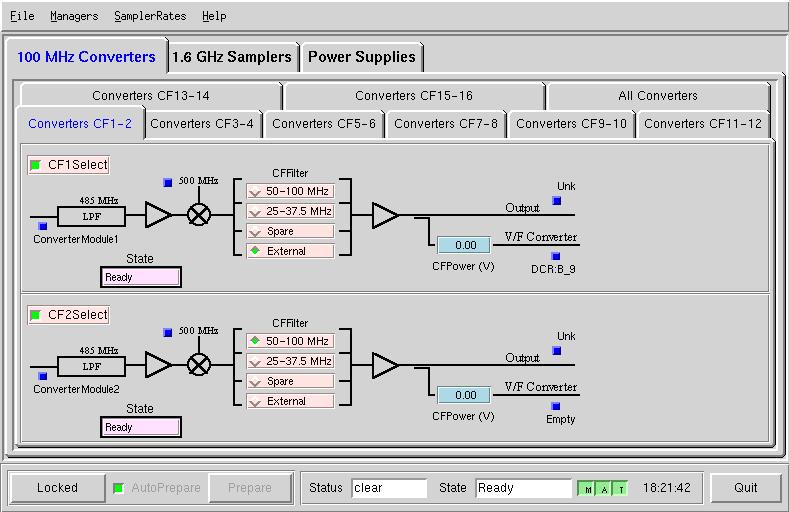
100 MHz Converters Tab:
The Analog Filter Rack Screen will open with the 100 MHz Converters Tab
active. Each of the Converter Pair Tabs under the 100 MHz Converter tab
opens a page with the following parameters for each of the two Converters:
Blue Buttons explained in a following
section, A Select button to activate the module with an
indicator for the State of the module, a selector for one of four filters,
one of which can be installed external to the module in a short amount of
time and a filter marked 'spare' which is reserved for a proposed digital
filter, and an indicator for the voltage produced by an RF power level
square law detector. This voltage is exponentially proportional to
the RF power level at the module output, a voltage of 0.1 volts is
approximately -10 dBm, 1 volt is approximately 0 dBm and 10 volts
approximately +10 dBm, better accuracy can be obtained from the individual
module detector's calibration data.
For optimal Spectrometer
operation a level of 1.0 volts is preferable. This voltage is also
sent to a voltage to frequency converter and the resulting frequency
stream from odd numbered converters is sent via optical fiber to the
Digital Continuum Receiver.
All Converters Tab:
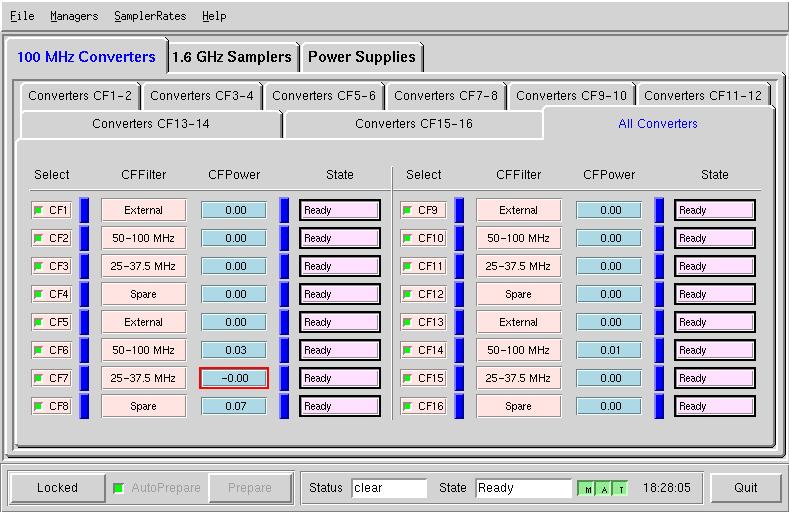
This is the CLEO page for All Converters which performs the same
functions for all sixteen Converter/Filter modules that the module pair
pages perform but without a signal flow diagram for the modules. The
Red Outline of the power in CF7 indicates that
parameter is out of its recommended range.
1.6 GHz Sampler Tab:
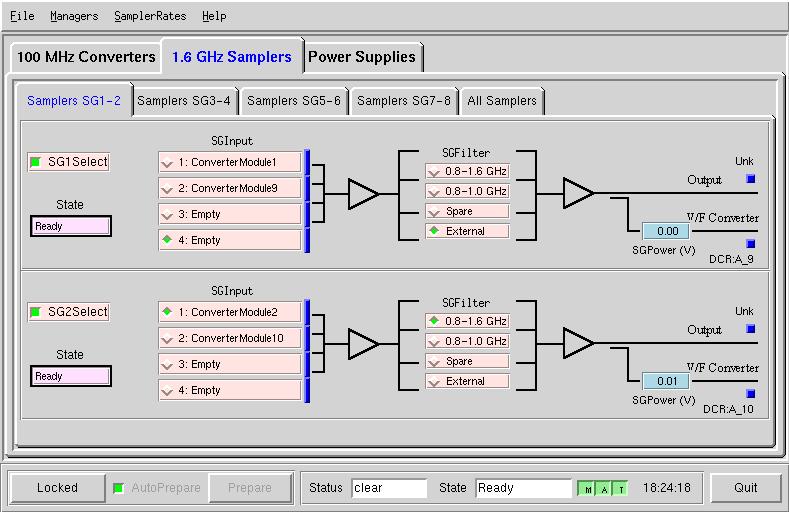
Pressing a tab for a pair of 1.6 GHz sampler modules opens the CLEO
page above, allowing (after unlocking
the module) the user to view and adjust the parameters
of a pair of Sampler modules. Each module has a Select button to
activate the module with an indicator for the State of the module, a
selector for one of four inputs from the Converter
Rack, a selector for one of four filters, one of which
can be installed external to the module in a short amount of time, and an
indicator for the voltage produced by an RF power level square law
detector. This voltage is exponentially proportional to the RF power
level at the module output, a voltage of 0.1 volts is approximately -10
dBm, 1 volt is approximately 0 dBm and 10 volts approximately +10 dBm,
better accuracy can be obtained from the individual module detector's
calibration data.
For optimal Spectrometer
operation a level of 1.0 volts is preferable. This voltage is also
sent to a voltage to frequency converter and the resulting frequency
stream is sent via optical fiber to the Digital
Continuum Receiver.
All Samplers Tab:
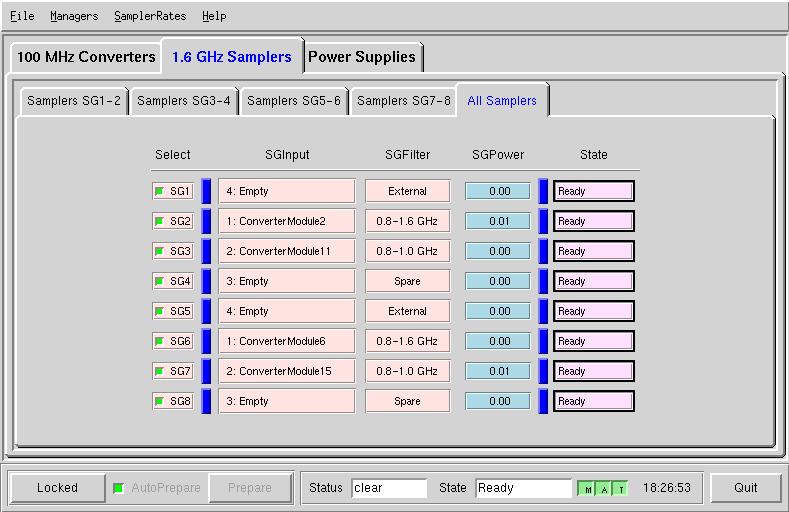
This is the CLEO page for All Samplers which performs the same
functions for all eight Sampler/Filter modules that the module pair
screens performs but without a signal flow diagram for the modules.
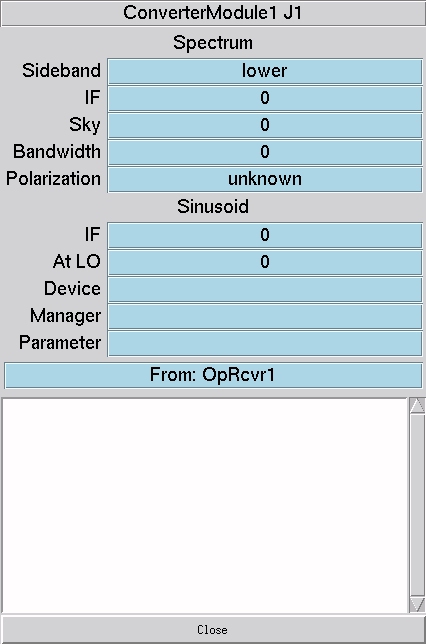
Blue Buttons:
On each of the pages for specific modules there are blue
buttons next to function selections that will open the IF
Manager screen information box on
that particular function. On screens controlling all the particular
modules the blue button opens a sub menu from which a specific input,
output or function information screen can be chosen. Information
such as where the signal on that particular input or output is coming from
or going to, frequency, bandwidth, polarization of that signal and the
manager controlling that function is available on a screen like this
one:
Power Supplies Tab:
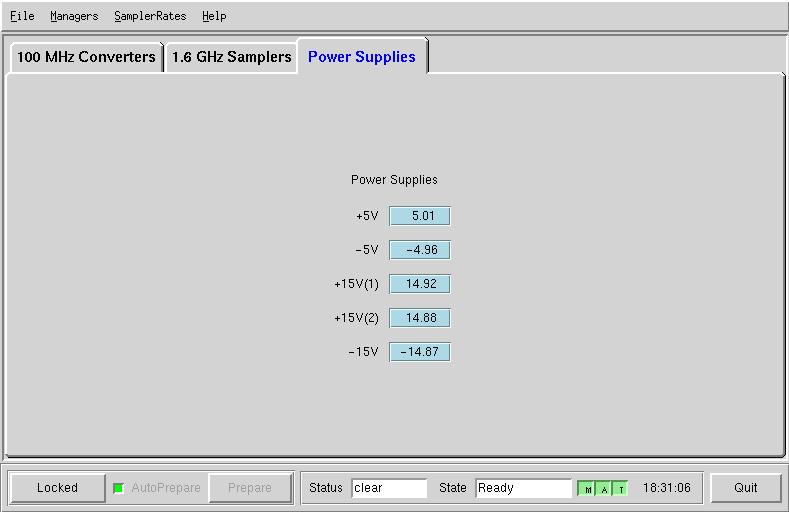
On this page are samplers
that monitor the power supply voltages for the Analog Filter Rack.
|