Green Bank Telescope Spectra

Documentation


glangsto -at- nrao.edu

created on:

2003SEP23

Test of a deep integration observation using the Green Bank Telescope and Prime Focus 1 receiver. A deep (2 hour) integration in the spectral band 795 to 845 MHz is presented to determine the RFIs level expected for sensitive searchs. A summary of RFI in the entire band was made on February 22, 2003.

See below for a description of the observing setup. These spectra are calibrated using an estimated for the system temperature, since no reference noise diode signal was injected. The system temperature spectrum was computed using a 14 channel median filter for each of the two average polarization spectra obtained. The intensity scale was set by multiplying by the effective system temperature (30K) and dividing by the system temperature spectrum. Note that this process removes any spectral features wider than the 14 channel median width (features wider than 85 kHz, corresponding to 30 km/sec velocity). Also sensitivity is reduced for spectral features within 14 channels of the brightest features.

The plot below shows a dual polarization observation of 3C286 in the frequency range 745 to 865 MHz. The high noise at the band edges is due to the attenuation of the band pass filter. The features at 796.53 and 817.77 MHz are due to features in the feed structure, not RFI.

The plots below show 1) the raw band pass shape, 2) calibrated band pass shape and 3) a selection of RFI features. Note that weak narrow features are moste easily seen by this data reduction technique. The estimated RMS in the two hour integration is 2 mK. For observation of a 1 Jy source (approx 2 K brightness temp), absorption features as weak as 1 % could be detected (10 sigma).

Caution should be used, when applying the median filtering technique produces features at the extream of the band pass gain (ie at minima or maxima of the gain). At these spectral locations, features as bright as +/- 20 mK are seen, corresponding to 1 % features in a 1 Jy source. Note since the gain functions are different for the two polarizations, band pass features do not match in the two polarizations.

RFI Table

The table below summarizes the strongest sources of RFI in the frequency range 750 to 900 MHz. The table also lists the redshift of neutral hydrogen corresponding to this RFI frequency. Higher resolution measurements of fainter features are presented for the 795 to 845 MHz band. The redshifts are calculated for the Delta_Frequency/Frequency convention.

The frequency range 807.25 to 885.25 MHz was assigned to TV channels 70 to 83, but is now assigned to land mobile communications (ie portable phones, etc).

Frequency Frequency Red RFI
Peak Width Shift Source Note
(MHz) (MHz) (z) Name
692.25 0.39 0.513 Channel 50 TV
696.63 1.29 0.510 Channel 50 TV
705.23 0.48 0.503 Channel 54 TV
712.34 4.66 0.500-0.495 Channel 54 TV
741.23 0.71 0.478 Channel 59 TV
753.27 0.69 0.470 Land Mobile strong RFI
777.25 0.69 0.453 strong RFI
781.75 0.72 0.449 strong RFI
795.29 0.46 0.440 Intermittent strong RFI
796.53 2.1 0.440-0.438 Feed Resonance not RFI
798.6889 narrow 0.438 T=0.1K
798.8689 narrow 0.437 T=0.1K
799.7591 narrow 0.437 T=21.3K
799.9930 narrow 0.437 Local RFI? T=0.04K
801.2518 narrow Chan. 69 Video T=5.5K
805.6720 narrow T=0.02K
805.7541 narrow 0.433 Chan. 69 Audio T=0.9K
805.8282 narrow T=0.04K
810.8420 narrow T=0.04K
812.8864 narrow T=0.25K
817.77 2.1 0.425-0.423 Feed Resonance not RFI
825.0007 narrow Local RFI? T=0.26K
827.2201 narrow T=0.1K
829.7415 narrow T=0.06K
834.6589 narrow T=0.74K
835.2595 narrow T=4.9K
835.95 broad 0.411-0.410 T=5K, to 2 MHz wide
837.05 broad 0.411-0.410 T=5K, to 2 MHz wide
838.3126 narrow T=0.2K
839.2357 narrow T=0.2K
844.2080 narrow 0.406 T=0.4K
856.28 0.78 0.397-0.396
869.64 0.92 0.387-0.388 weak RFI
880.34 1.95 0.381-0.379 weak RFI
894.27 0.79 0.370

Plot of the raw spectrum obtained towards a pulsar at low galactic latitude. The band pass shape is primarily due to the combined effect of a number of band pass filters in the IF chain.

The central "peak" is due to a resonance in the Feed structure, that reduces the system gain and increases the effective system temperature. A few RFI features are also clearly seen, indicating that these features have a spectral intensity comperable to the system temperature, 30 K.

Ascii Data (2003_09_21_17:37:39A.0.log)

Calibrated dual polarization observation showing the residual RFI features.

Ascii Data (2003_09_21_17:37:39A.1.log)

Zoom in on the calibrated spectra showing a strong RFI feature and two associated RFI peaks offset by 78 kHz. A linear fit has been subtracted from this spectral region, and a Gaussian fit to the brightest peak.

Ascii Data (2003_09_21_17:37:39A.2.log)

Selected RFI features, after subtraction of a linear baseline.

Ascii Data (2003_09_21_17:37:39A.3.log)

Zoom in on the average uncalibrated spectrum, showing the communcations signal which dominates the spectral range 835.95 to 827.25 MHz. This signal is not always present. Fit:-11.938+/-0.159 Sl:0.014+/-0.000

Ascii Data (2003_09_21_17:37:39A.4.log)

Observing Setup

The data were taken in tandem with a BCPM pulsar observation by Ingrid Stairs. The observation used the GBT Prime Focus 1 receiver with the 800 MHz feed installed. The IF chain was configured for a dual circular polarization observation using optical driver modules 1 and 3 and converter rack modules 1 and 5. The LO1 sky frequency was 820 MHz and the convert rack lo2 frequency was 11155 MHz. The 50 MHz, dual polarziation, single quadrant mode of the spectrometer was used. A single two hour scan was performed, using 
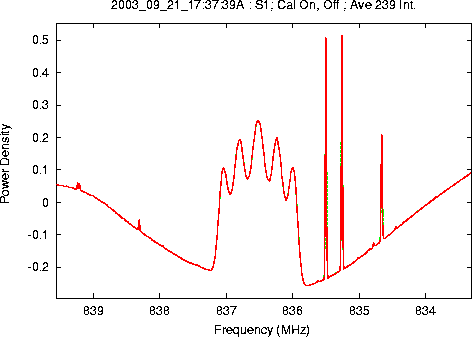
30 second integrations (a total of 239 integrations are in the output FITS file).

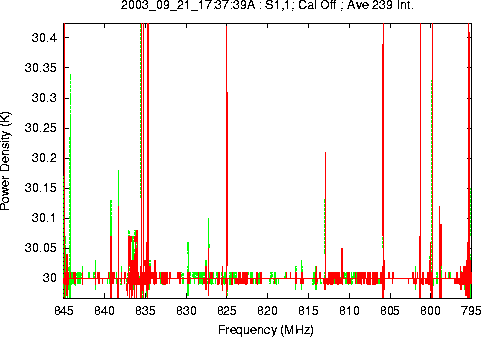
During these observations no calibration signal injected into the IF path, so the intensity scale must be calibrated assuming an effective system temperature. 
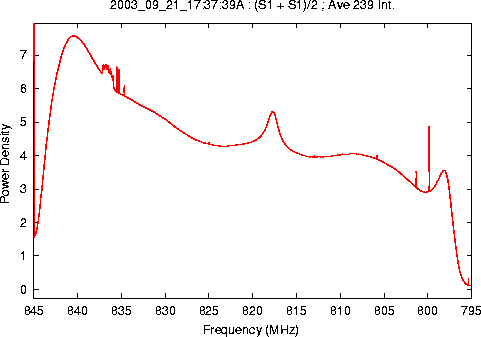
For the spectra below, the intensity scale was set assuming a 30 K system temperature. 
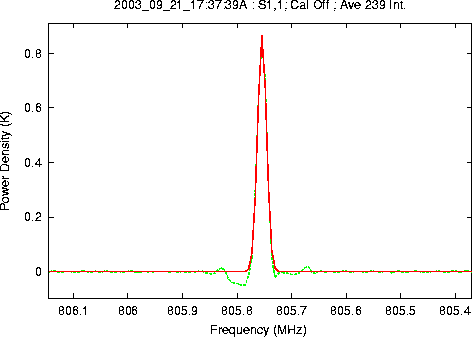
The spectra have 8192 channels, corresponding to a spectral resolution of 6,104 Hz per channel.

Since the observations were performed without injection of the noise diode signal, the normal calibration process could not be applied. Normally the Cal noise diode signal would be injected during a deep search for faint spectral features. The average of the cal signal over the observation would normaly be used to first correct for the system gain variations. In this case, the gain variations, would not contribute signficantly to the 
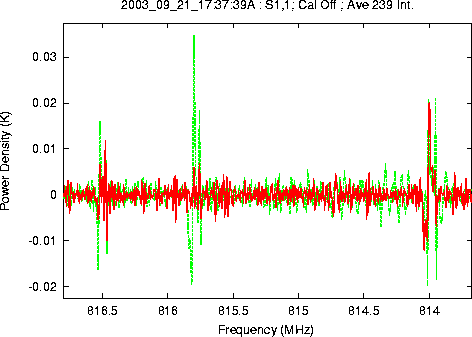
noise in the spectra. A more important limit on detecting faint features are the numerous weak RFI features. These must be detected by their intensity variations and excised before averaging.

These data were obtained by Glen Langston for Ingrid Stairs using the GBT. The data were taken towards a pulsar, but no significant contribution is expected from the pulsar emission.

Data were written to directory:
/home/gbtdata/AGBT03B_014_01

Modified on 2004-Jul-16