| Image | Date | Frequency | Note |
| (UTC) | (GHz) | |
 |
2001 Feb 05 | 0.8 |
Prime Focus Observations.
First commissioning Observations with the GBT.
Source 3C147 is clearly visible in the center of this scan along a line
of constant declination. This scan was plotted using AIPS++.
An image of this scan is also available.
|
 |
2001 Feb 06 | 0.8 |
Prime Focus Observations.
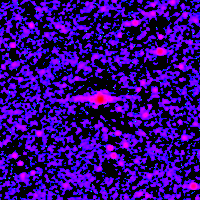
The image at left shows source 3C295 at the center of the cross scans
along lines of constant Right Ascention and Declination. The second
offset peak along the line of constant declination is due to Radio
Frequency Interference (RFI).
In this image, red indicates more intense emission, green indicates
regions of less emission and blue/black indicates least emission.
The image at left has 1 arc minute square pixels. The image is made of
'I' polarization, by combining the two circular polarization IF's.
Note that for the first few days, the circular and linear polarization
data were flipped. The intensity scale is in units of T-cal. so to convert
to Kelvins, the image must be multiplied by the effective temperature of the
Cal signal, approximately 2 Kelvins.
|
|
2001 Feb 07 | 0.8 |
Prime Focus Observations.
|
|
2001 Feb 08 | 0.8 |
Prime Focus Observations.
|
|
2001 Feb 09 | 0.8 |
Prime Focus Observations.
Problems prevented any observations this night.
|
|
2001 Feb 13 | 0.8 |
Prime Focus Observations.
|
 |
2001 Feb 14 | 0.8 |
Prime Focus Observations.
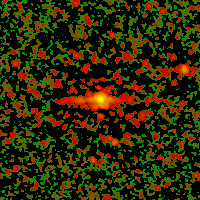
3C147 and 3C295 beam maps. Data are gridded to show serious RFI problems.
The source 3C147 is in the center of this image. Raster scans are made along
lines of constant declination.
An identically shaped 5 GHz NVSS Image
is available for comparision. Note that several of the fainter components
near 3C147 appear to be sources, not sidelobes.
|
|
2001 Feb 15 | 0.8 |
Prime Focus Observations.
M&C FITS file scan numbers correct. Before this night, the Scan Logs
and Fits files have inconsistent scan number.
The source of the RFI was found to be space heaters on the GBT site.
These were turned off and the problems cleared.
|
 |
2001 Feb 16 | 0.8 |
Prime Focus Observations. Virgo A Beam Maps.
Image peaks are satureated. A second image
of Virgo was made.
An identically shaped 5 GHz NVSS Image
is available for comparision.
|
 |
2001 Feb 17 | 0.8 |
Prime Focus Observations. 3C147 Beam Maps.
The sense of the 800 MHz polarization switch is correct in these observations,
and I polarization images are produced from the combination of X and Y
linear polarization data. The data are gridded so that the individual
points in the scans are visible.
These observations were made before the hysteresis effect (due to
a time tag error) was fixed.
|
 |
2001 Feb 21 | 0.8 |
Prime Focus Observations. 3C147 and 295 Beam Maps.
Note that for the image at left, the time tag errors are still present
in the raw DCR data, but the time tages have been corrected when
combined with the antenna pointing data. The adjacent scans are well
matched and there is very little RFI.
A smooth version of the image at left was
used to measure the ratio of the peak to first side lobe. There is a
peak to the south west of the main peak, with height of 1 T-Cal. The
source peak is 19 T-Cal.
|