


 : Figure 5
Radio source 1413+135 is one of 5 sources in our sample. The properties of these 5 sources are summarized in table 1.
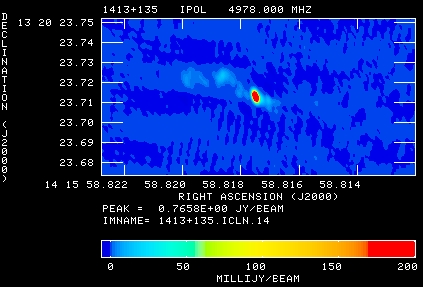
The radio source is compact, < 0.1 arc seconds in extent, and is a VLA calibration source. The source was monitored daily by the Green Bank Interferometer (GBI), between October 1989 and June 1994. It was the remarkable GBI (Waltman et al. 1992, Figure 1) data which brought our attention to this source. Perlman et al. 1996 have published excellent images of 1413+135. These images did not resolve the central component of 1413+135, but did show the spectral properties of the outer regions which explain the nearly constant brightness of the 1413+135 at lower frequencies.
The high time variability of 1413+135 at X band, a 50 % increase in 0.3 years, indicates it has components smaller than 0.08 pc. This corresponds to an angular size of 35 as, assuming = 100 km/sec/Mpc and = 0.5.
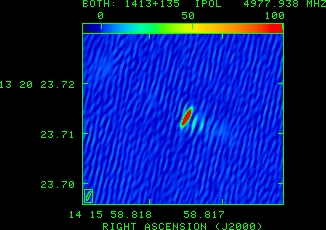
The optical host of 1413+135 appears to be a spiral galaxy, as shown by the HST image in Figure 4. The VLBA image of 1413+135 at C band is shown in Figure 5. The VLBA plus VSOP image is shown in Figure 6. The VLBA + VSOP data resolve the more extended ``lobe'' components, and show the jet components close to the core. Perlman et al. 1996 find no evidence for motion of the components of 1413+135 on scales larger than 2 mas. Their measurements of the spectra of the jets, along with limits on the temperature of the gas surrounding 1413+135, are consistent with a young or recurrent model for the source.
The VLBA image in figure 5 is approximately the size of one pixel of the HST image in Figure 4. The VSOP+VLBA image has approximately 3 times the resolution of the VLBA only image, as expected. The more extended components of 1413+135 visible in the VLBA only image are resolved out in the VSOP image.
Still higher resolution and more frequent observations of 1413+135 are needed to explain the high core variability. Planed future Space VLBI missions will provide sufficient sensitivity and resolution to resolve the core of 1413+135. GBI monitoring of 1413+135 has resumed, and the data suggest that 1413+135 appears to have begun a quiescent period.
| IAU Name | Survey Name | Source Type | Red Shift | Note |
| 0201+113 | OD+101 | AGN | 3.560 | |
| 0923+392 | 4C39.25 | QSO | 0.699 | Alberdi 1993 |
| 1116+128 | 4C12.8 | AGN | 2.118 | |
| 1413+135 | OQ+122 | BL Lac | 0.247 | Highly Variable |
| 2344+094 | OZ+073.5 | Seyfert I | 0.673 |