(using S(23GHz) = 2.375 JY for 3C286 (from Ott et al))
Observations
Scans 17-56 were a series of nodding scans, putting the calibrator 2C386 alternately in beam 3 and 4. Each scan was 30 seconds in length consisting of 1-second integrations.The DCR (digital continuum receiver) recorded two IF bands of 800 MHz bandwidth from each of the two beams and using two polarizations, hence 8 channels total. Due to an error in configuration, beam 3 was observing a band centered at 23 Ghz, and beam 4 at 24 GHz. The intention had been for each beam to observe two frequencies. Nevertheless, the setup is summarized in the following table.
| rx | DCR_channel | Pol/feed | center_freq | Tcal |
|---|---|---|---|---|
| 1 | 9 | L3 | 23 GHz | 5.15 K |
| 2 | 10 | L4 | 24 GHz | 3.18 K |
| 3 | 11 | L3 | 23 GHz | 5.15 K |
| 4 | 12 | L4 | 24 GHz | 3.18 K |
| 5 | 13 | R3 | 23 GHz | 5.27 K |
| 6 | 14 | R4 | 24 GHz | 5.01 K |
| 7 | 15 | R3 | 23 GHz | 5.27 K |
| 8 | 16 | R4 | 24 GHz | 5.01 K |
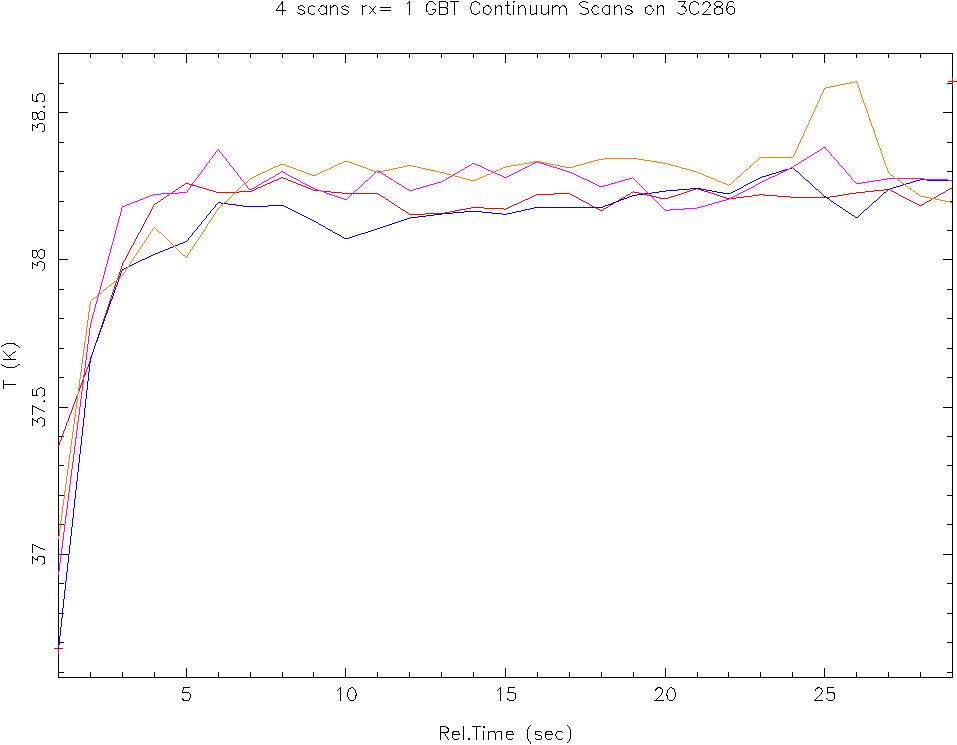
One may note that the antenna does not settle on the source until 5 seconds or so after the data taking starts. Therefore, we will eliminate the first 6 seconds of data from all scans for the analysis.
Analysis
There are several contribution to noise-like fluctuations that affect continuum observations. The total rms noise, dTtotal, includes components:dTtotal^2 = dTr^2 + dTa^2 + dTg^2
in which
- dTr is due to receiver and electronics noise, as given
in the familiar radiometer equation.
dTr = Tsys/sqrt( Npol * Tint * BW)
- dTa is the rms atmospheric fluctuations.
- dTg is the rms gain fluctuations not accounted for by the radiometer equation ( 1/f noise).
Radiometer noise For and 800 MHz bandwidth and single polarization, the radiometer equation gives dTr = 1.3 mK for integration time Tint = 1 sec, and dTr = 0.4 mK for Tint=10 sec.
Atmospheric noise To estimate the atmospheric term (dTa)
we take the data for each
30-second scan, convert to units of temperature, and determine the
rms residuals to a linear fit. The linear fit simulates the effect
of baseline removal or beam switching at a few second rate.
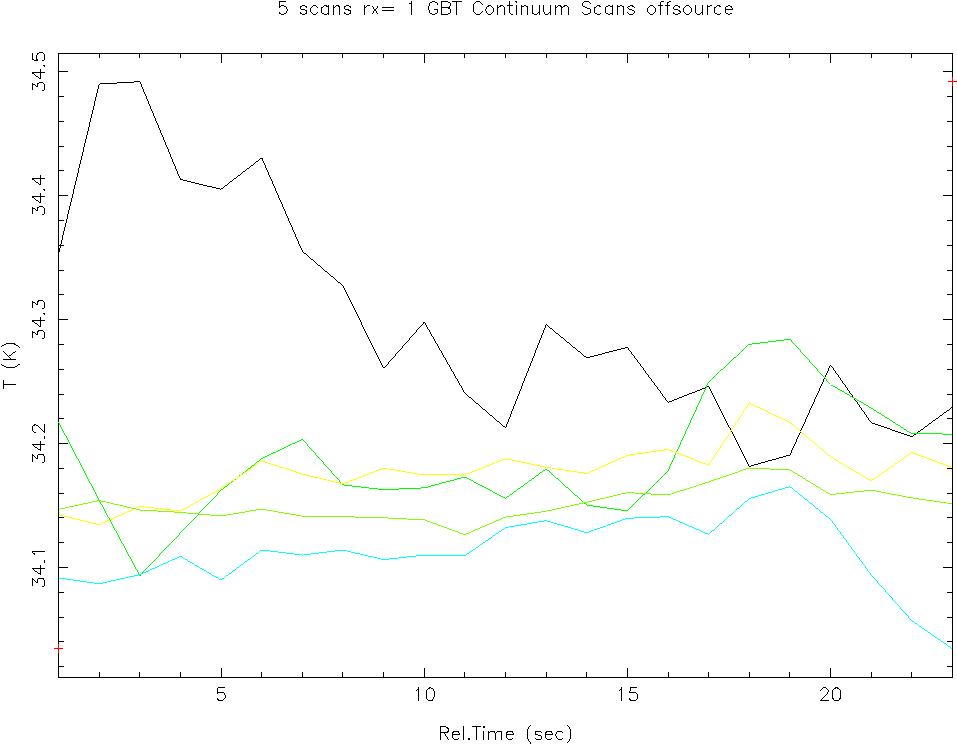
For off-source scans, this rms is an estimate of atmospheric fluctuations;
for on-source scans, it includes the additional effects due to
a strong source.
Some typical blank sky scans are illustrated in the next graph,
(Linear fit not removed).
Gain fluctuations.
To estimate the gain fluctuations, we look at the difference between
the noise-cal-on and noise-cal-off phases. The calibration noise
source is injected before the first amplifier stage and is switched
on and off at a 1 Hz rate. The DCR integrates the power from these
two phases separately. Thus for each integration we can look at the
"delta_cal" or the difference between the cal-on and cal-off phases,
and knowing the value of the calibration (Tcal) in temperature units,
one can convert this difference to temperature units. The delta-cal
is proportional to the gain (i.e., the conversion between counts and
temperature). The rms of the delta_cal over a scan gives an estimate
of the gain fluctuations.
Specifically: dTg = Tsys * rms(delta_cal) / median(delta_cal)
The following graph shows Tsys * delta_cal / median(delta_cal)
for a few typical scans. The plot is for beam 3, offsource.
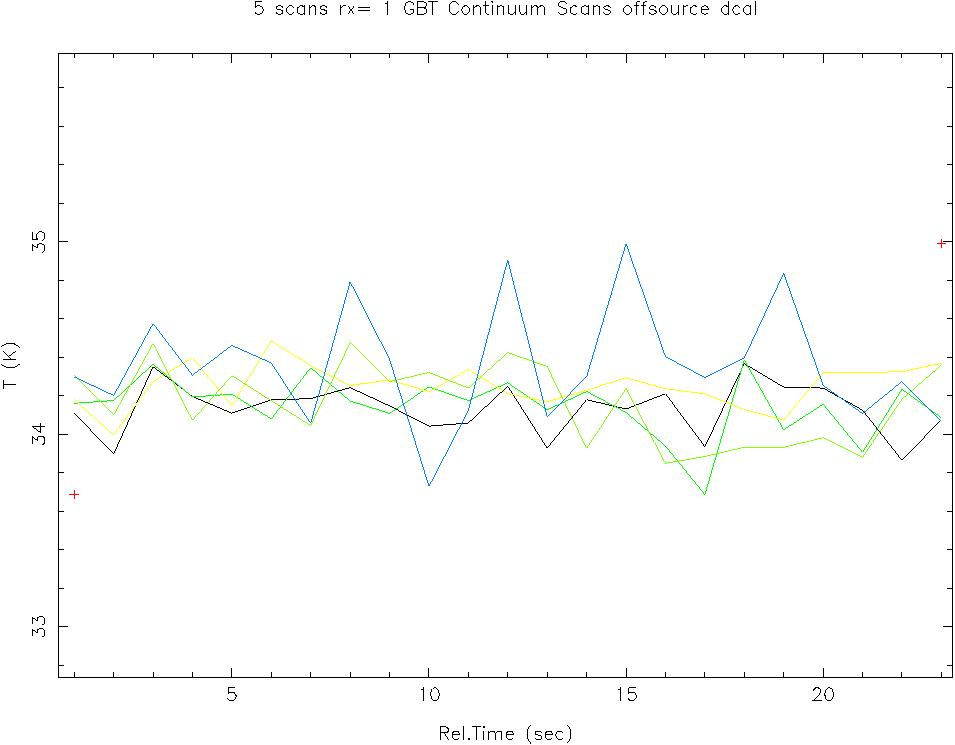
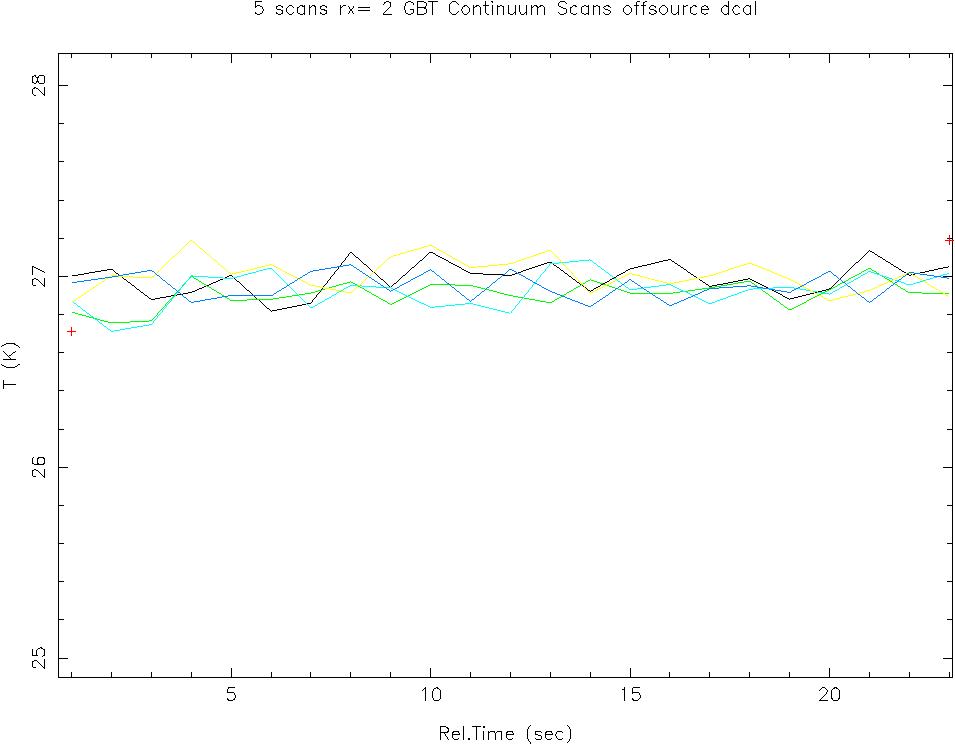
It is of interest to note that beam 4 seems to perform
considerably better than beam 3. The next graph shows
the similar plot for beam #4.
Conclusions: RMS fluctuations vs integration time.
The statistics described above (dTa and dTg) were determined for individual scans, i.e., for integration time of one second. Also the quantities were computed for the average of 2, 5, 10, and 20 scans, to give results for integration times of 2, 5, 10, and 20 seconds.Since beam 3 appears to be excessively noisy, we will consider only beam 4 and will look at the off-source data. This will give results relevant to detecting faint sources. The results, with rms temperatures in milli-Kelvin (mK) are summarized as follows.
| statistics for beam 4 | ||
|---|---|---|
| Tintegration | dTa (mK) | dTg (mK) |
| 1 sec | 13 | 83 |
| 2 sec | 8.6 | 65 |
| 5 sec | 6.0 | 43 |
| 10 sec | 3.9 | 27 |
| 20 sec | 2.0 | 20 |