The object was to check whether the LO blanking of the spectrometer was working correctly and that the LO frequency and exposure times were correct.
Test Run, Aug 21, C-band
The bottom line, for the impatient:
In the Sept 01 run, both a test tone and an astronomical
signal were observed in the same band.
Scans were done both with and without LO blanking enabled.
The bottom line:
On August 21, we tracked a H110-alpha line (rest freq = 4874.157 MHz) source and did off-on scans, with the addition of a test tone at 4875 MHz. The spectrometer was used in mode 1N1-0A-12-3 (one quadrant, one sampler, 12.5 MHz bandwidth, 3-levels, 65536 channels, channel spacing 191 Hz). The scan that was examined was scan number 53, project 'Tfghigo_aug21', which was an off-source scan with the test tone at 4875 MHz injected at a power level of -70 dbm. The scan consisted of 500 one-second integrations. The LO frequency tolerance was 5 Hz, and the frequency updated about every 10 seconds.
For each integration, we determined the mean frequency of the test tone peak. The test tone was apparent in 4 successive channels. The weighted mean frequency was computed over a range of 15 channels centered on the peak, weighted by the amplitude.
Another anomaly is that the exposure times are all near 0.24,
where we would have expected them to be close to 0.5 seconds.
The specified integration time was 1 second, and there were
two phases: cal-on and cal-off, so we would expect about half
a second exposure time per phase. Yet the spectrometer is
indicating about half the expected exposure.
The next two plots show integrations number 18 and 19, where the
test tone power in the cal-on phase increases significantly in
integration number 19.
The project was 'TLO1_fg_Sep01'. Scans of 10-minute length were run with an integration time of 3 seconds, yielding 200 integrations in a scan. The LO tracking tolerance was 1 Hz, and we noted that the LO updated about every 20 seconds during each scan.
Two scans were examined:
For each of the 3 lines, the mean frequency was calculated by taking the weighted mean of the frequency for the channels across the line, and weighting by the amplitude of each channel. Also calculated were the width and the integrated counts of each line. This was done for each of the 200 integrations in the scan.
Plot of the whole 12.5 MHz band, for integration number 100 out of 200.
The peak on the left is the test tone. The highest peak is the
1665.4 MHz OH line from W3OH, and the peak on the right is the 1667.4 MHz
line.
Close-up of the 1665.4 MHz OH line
The small peak on the right ("1665.67MHz") was examined, as well as
the main peak.

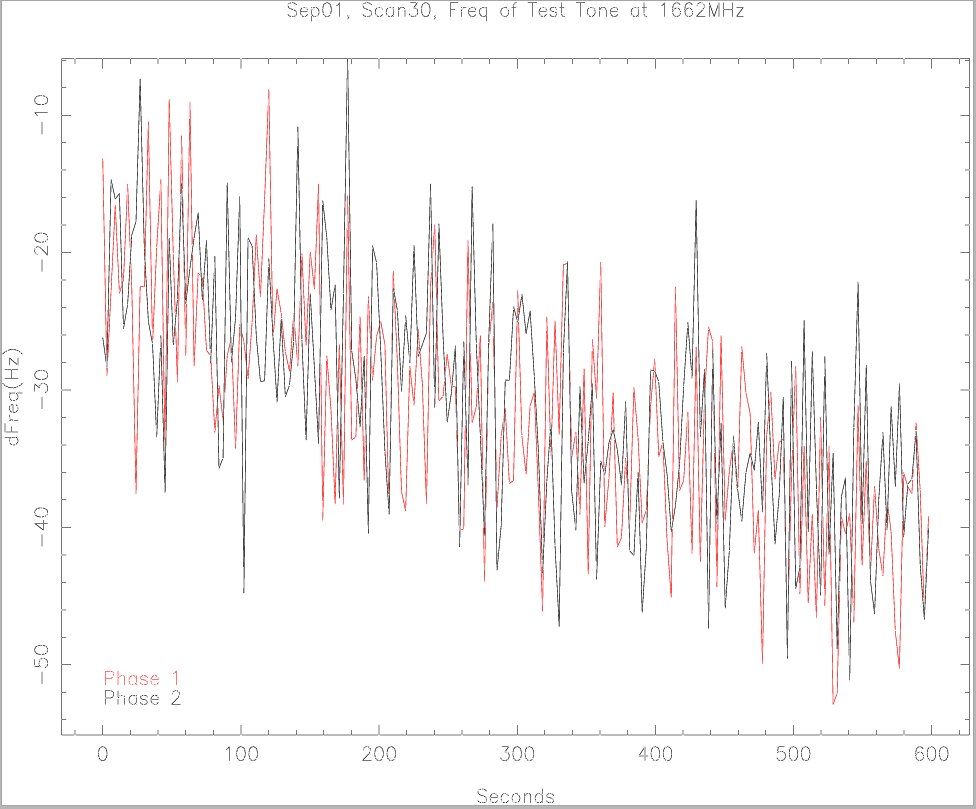
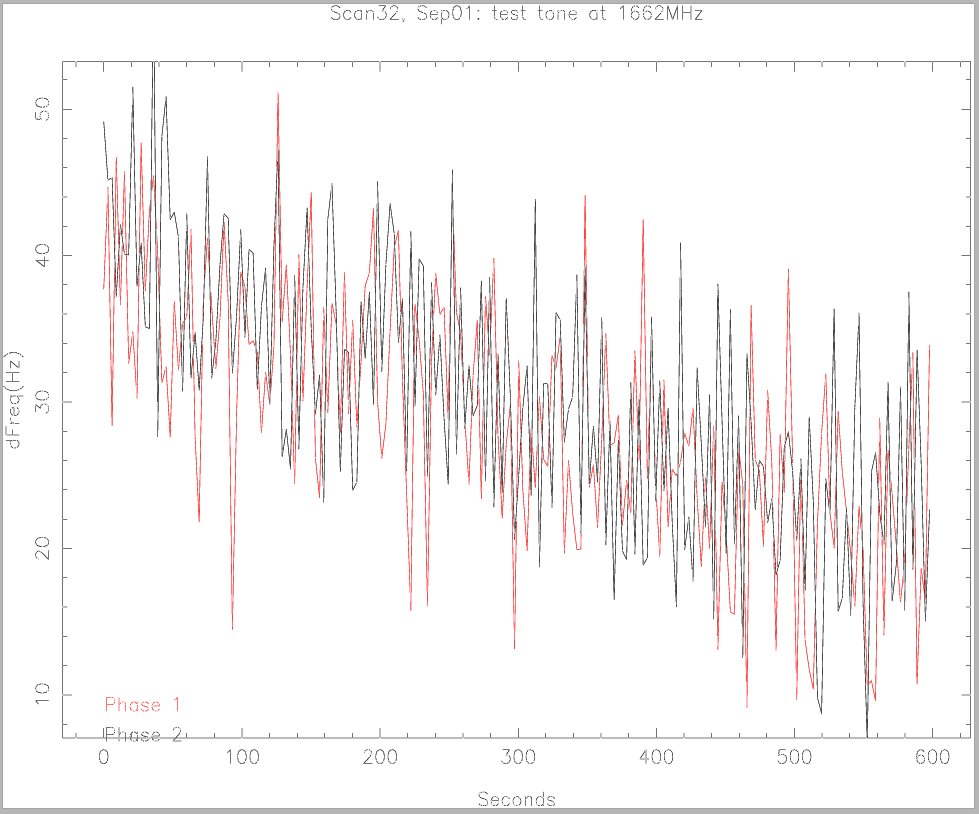
Plots of test tone frequency
The next two plots show the tone frequency as function of time,
first for scan 30 (LO blanking enabled), next for scan 32
(LO blanking disabled). There seems to be no significant difference
between these plots. They both have an rms of about 7 Hz about
a linear trend. The frequency is changing smoothly througout the
scan, as one would expect.
Exposure Time, scan 30.
The exposure time is plotted for scan 30. We see that
the exposure time drops, corresponding to the blanking,
but this does not happen for every change in the LO.
The LO frequency changed about every 20 seconds, but there was not
a corresponding drop in the exposure time for all LO frequency changes.
No drops are seen near the beginning of the scan and near the end.
Exposure Time, scan 32.
In scan 32, the LO blanking was disabled. Here we see
the exposure time constant throughout the scan.
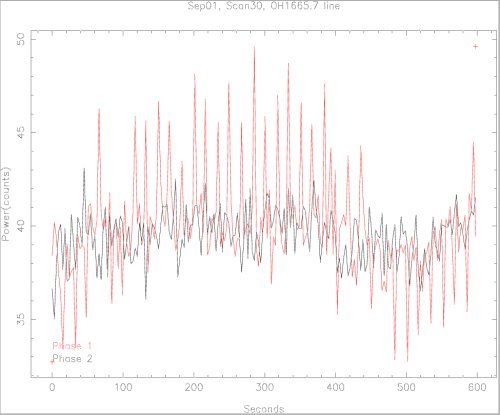
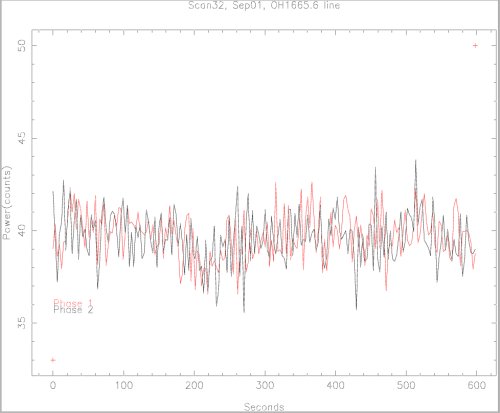
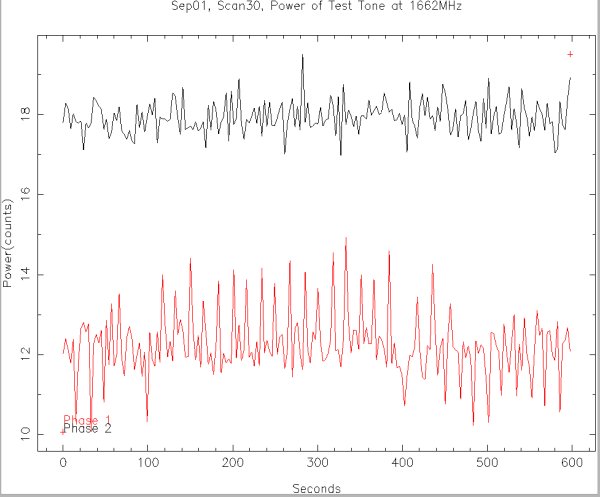
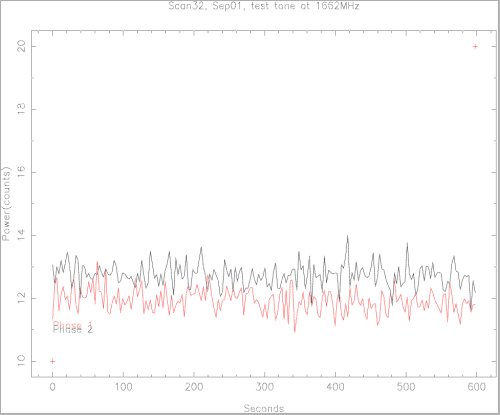
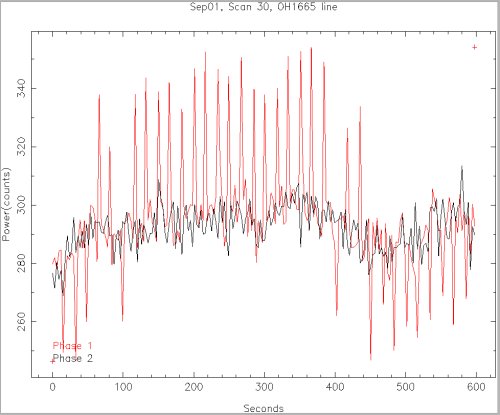
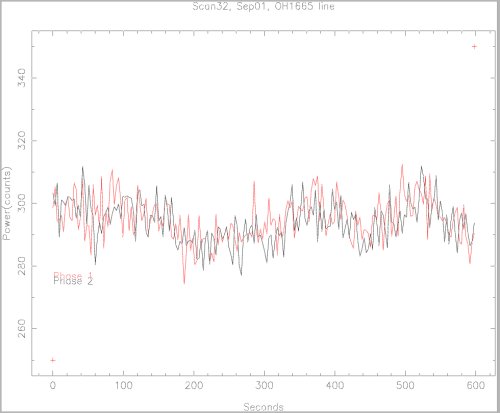
Test Tone Integrated Counts
Scan30: The power in the test tone showed a significant jump
whenever the LO frequency changed. This jump is seen only
in phase 1 (probably the cal-on phase).
Note that in the corresponding plot for Scan 32, this effect
is missing. The LO frequency tracking is happening in
both scans, but we see the jumps in power only in the scan
where the LO blanking is enabled. Thus the blanking signal
must be causing the power jumps.
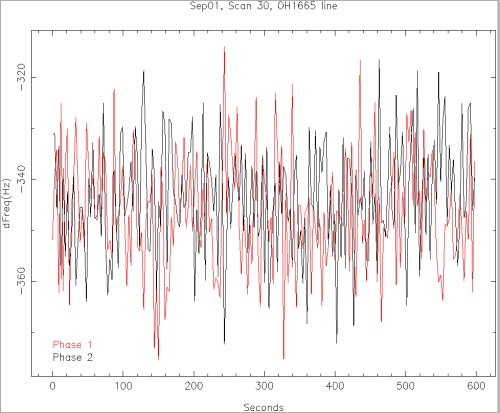
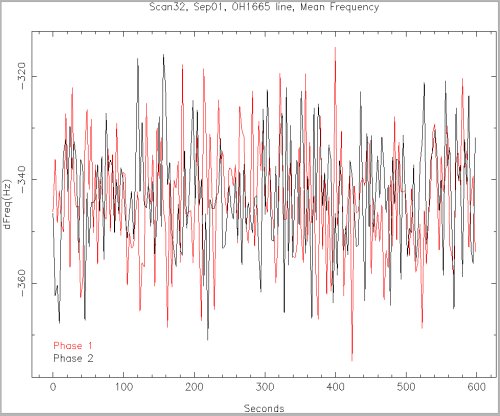
OH 1665 main line
The mean frequency of the OH1665 line is shown in the
next two plots. The frequency is constant, with an
rms of about 11 Hz. There is no apparent difference
between the cases with and without LO blanking.
OH 1665 power
The integrated counts show the same effect for the OH line as
for the test tone. Phase 1 has spikes that apparently happen
in the integrations when blanking is happening. This is
seen in Scan 30 where LO blanking is enabled, and not in
scan 32, where blanking is disabled.
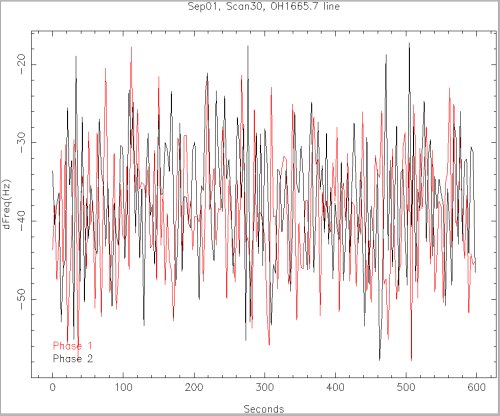
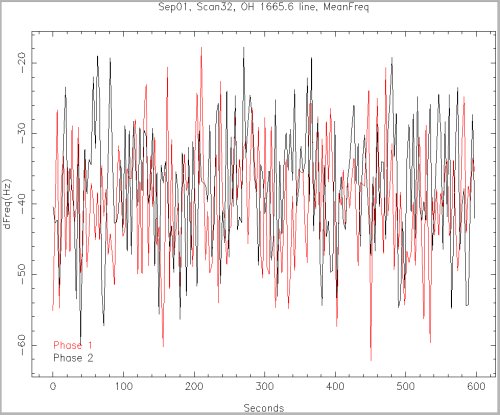
OH 1665.67 side line
This line is narrower than the main OH1665 line.
These two plots show the mean frequency of the line for
each integration of the scan. Scan 30 (first plot) was
done with LO blanking enabled, and Scan 32 with blanking
disabled. The scatter in both plots is about 7 Hz, and to this accuracy
the frequency of the line is stable throughout the scan.
These two plots show integrated counts of the the 1665.66 line.
Again, one phase shows spikes in the scan when LO blanking
is enabled, and no spikes when disabled.