 Station Diagnostic Software
Extensive diagnostic and plotting software is used to analyze the
satellite data and timing links.
The diagnostic software is divided into three major groups,
- Log Analysis
- Extraction and display of station monitor data, such as
temperatures, LO levels, timing offsets, etc.
- Phase Residials
- understand the properties of the offset between predicted and
measured downlink frequency allows measurement of many system
parameters. The magnitude of the difference measures the
error in the satillite orbit. The RMS of the frequency difference
measures the quality of the link. Smooth, but short term, variations
in the frequency offset, is indicative of problems with stability
of some station hardware component.
- Telemetry Data
- VSOP/HALCA downlinks a large volume of data recording
satellite status. In particular, the uplink power recieved
and the frequency offset from nominal are repored.
Also the state of the on-board astronomy systems is reported.
Log Processing
The primary program for analyzing the station logs is "logRead",
which allows extraction of selected log entries. Plotting
scripts have been written which use logRead output to
present log data in a convenient form.
logRead
The program logRead can produce an ascii listing of selected
types of log entries. Any of the three main type of log
entries may be choses, Events, Anomalies or Monitor data.
The program allows data to be selcted by time range and also
the output format can be specified.
vsopDownPlot
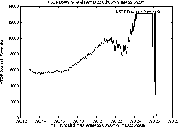
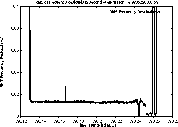
The vsop downlink power is plotted with script vsopDownPlot.
The downlink signal (in Kelvins) is plotted versus truncated MJD.
An example for experiment VT136 is shown below:
Phase Residual Processing
The primary program for analyzing the phase residual data
is "twtPlot". The twtPlot program allows selection, fitting
and averaging of phase residual data.
This program takes a binary residual phase file and produces an ascii
listing of the data.
residualPhasePlot
The script residualPhasePlot runs the twtPlot program for
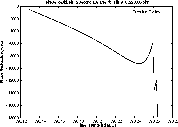
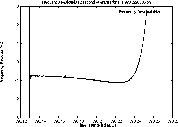
a selected tracking pass and produces three plots:
- Residual Phase
- Difference between predicted and measured downlink phase during
the tracking pass. Each time the downlink is lost, the residual
phase count is reset to zero.
- Residual Frequency
- The residual frequecy is calculated by a fit to the slope of
the residual phase data over a two second period.
- RMS Frequency
- The RMS after subtracting the linear model to the phase data.
Below are the plots for the tracking pass for experiment VT136.
Telemetry Processing
The program "vsopCheck" extracts telemetry header data
from the realtime logs for display.
vsopLinkPlot
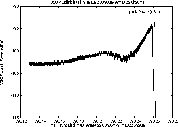
The script "vsopLinkPlot" runs vsopCheck to plot the "AGC" level of the
HALCA/VSOP link. This level is a function of both
the stability of the uplink signal frequency and the uplink power
level.
orbit error estimation
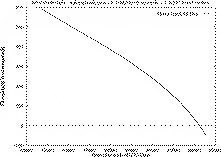
Under the assumption that all of the orbit error is along the trajectory
of the orbit, we can estimate the error in the orbit. This is done
with the script "orbitErrorPlot". This estimation of the orbit error is
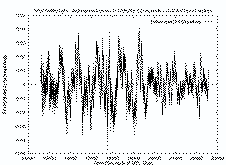
useful for the MIT Near Real Time Correlator. "orbitErrorPlot" also fits
a polynomial to the phase residuals and plots the residual to the fit so
that fluctuations in the two-way timing link with VSOP can be studied.
Below are plot of the residuals to the two fits done by "orbitErrorPlot".
 Return to the Station Software Guide.
The National Radio Astronomy Observatory
(NRAO)
is a facillity of the
National Science Foundation
operated under cooperative agreement by
Associated Universities, Inc.
glangsto@nrao.edu tminter@nrao.edu Last update: 97 July 7
 Station Diagnostic Software
 Station Diagnostic Software


