Section 2 of this memo describes the Receiver Room LO Rack equipment and the LO Reference Distribution system. Section 3 describes the Receiver Room IF Distribution, Section 4 the Equipment Room IF Distribution equipment, and Section 5 the frequency conversion formulas and frequency constraints for each of the GBT front-ends. Section 6 gives IF interface information for the GBT backends, and Section 7 some examples of equipment setups.
In each of the installed front-ends (on the Gregorian turret or on the prime focus boom) a frequency conversion is performed to produce the first IF signal. Table 1-1 lists the first IF center frequency and bandwidths for the GBT receivers. The mixer for the first conversion is located inside the prime focus front-end box or on a plate attached to the Gregorian front-ends' dewar, and the first mixer local oscillator signal is provided by the system LO1 synthesizers (via the LO Router described in Section 2).
Coaxial cables connect the first IF signals to the IF Router, located in the IF Rack on the turret center post. The IF Router allows the user to select several of the IF signals for connection to Optical Fiber Driver modules which transmit the signals over optical fibers to the Equipment Room located off the antenna.
At the Equipment Room, the optical fibers connect to Optical Receiver modules in which the IF signals are demodulated, amplified, and split for distribution. The Optical Receiver module outputs connect to Converter Modules. The Converter Modules, with associated local oscillators, are tunable over the 1-8 GHz input frequency range, and provide switch selectable outputs for various supported backends.
         RX     GHZ         1st LO     1st IF Band
     No     LOW   HIGH  Range      Cen/BW (GHz)   Polarization
    ___________________________________________________________

     P-1   0.68   0.92  1.76-2.00  1.08/0.02,...  Dual Lin/Circ
     P-2   0.51   0.69  1.59-1.77  1.08/0.02,...  Dual Lin/Circ
     P-3   0.39   0.52  1.46-1.60  1.08/0.02,...  Dual Lin/Circ
     P-4   0.29   0.40  1.37-1.48  1.08/0.02,...  Dual Lin/Circ

       1   1.15   1.73  4.15-4.50  3/0.6          Dual Lin/Circ
       2   1.73   2.60  7.73-8.60  6/1            Dual Lin/Circ
       3   2.60   3.95                            Dual Lin/Circ
       4   3.95   5.85  6.9-9.0    3.2            Dual Lin/Circ
       5   5.85   8.20                            Dual Lin/Circ

       6   8.00  10.00  11-13      3/2, 3/0.5     Dual Circular
       7  10.00  12.40                            Dual Circular
       8  12.00  15.40  9.0-12.5   3/3.5,3/0.5    Dual Circular
       9  15.40  18.00                            Dual Circular
      10  18.00  22.00  14.5-17.5  6/4            Dual Circular

      11  22.00  26.50  16-8.5     6/4.5          Dual Circular
      12  26.50  33.00                            Dual Circular
      13  33.00  40.00                            Dual Circular
      14  40.00  52.00  8.5-11(X4)                Dual Circular
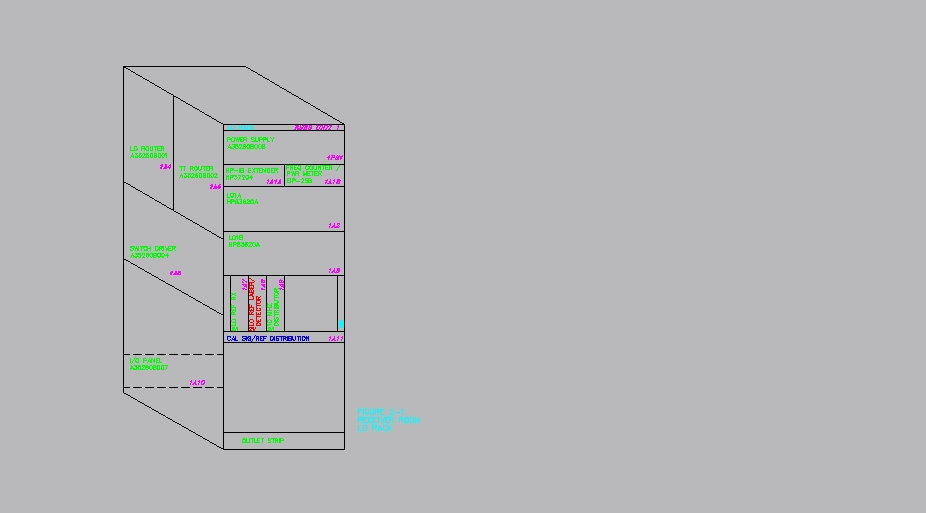
The Receiver Room LO Rack is shown in Figure 2-1, and the block diagram is shown in D35260K003. Components consist of two LO1 synthesizers, the LO Router, and the Test Tone Router. These generate LO signals for the receiver front-ends and allow the signals to be connected to the proper front-end ports. In addition, the Test Tone router allows the user to inject test signals into the front-ends for system checkout. Detailed descriptions of the operation of this equipment is provided in A35260D001, "GBT LO System Monitor/Control".
The LO Reference Distribution system, also shown in D35260K003, accepts a 100 MHz and 10 MHz signal from the hydrogen maser standard located in the Timing Center, multiplies the 100 MHz to produce 500 MHz, and transmits 500 and 10 MHz signals using single-mode optical fiber over separate links to the GBT Equipment Room and to the GBT Receiver Room. There 500, 10, and 5 MHz (generated by dividing the 10 MHz signal) are distributed. In addition, a 500 MHz signal is returned over separate fibers to the Timing Center where Round-Trip Phase modules are used to measure the round-trip delay for the 500 MHz signal. The measured delay is available via the GBT M/C system.
Components of the LO system located in the Equipment Room are described in the following sections in conjunction with the IF system.
The microwave switches utilize solid-state PIN diodes for stability, speed, and reliability. Microwave components in the IF Router are specified to operate over the 0.1-8.0 GHz range. In current receiver plans, all front-ends produce first IF signals within the 1.0-8.0 GHz range. The extra bandwidth below 1 GHz is provided in the IF Router in case the need arises in the future to transmit IF signals in that range.
The Router IF input connectors provide a convenient location to reconfigure the system manually if required. For instance, an IF cable could be moved from input IF-2 to IF-33. Although this requires a trip to the Receiver Room, it could prove useful for unusual programs such as dual-frequency observing, the installation of new receivers, tracing unusual problems, or other special cases.
The optical laser transmitter has a rather high noise level, so the IF signal should be maintained above the recommended minimum input level (-35 dBm). The step attenuator (AT1) and the detector power monitor provide means to adjust the transmitter input power. The step attenuator (AT2) is a GaAs MMIC type for stability, speed, and reliability. Microwave components in the Optical Fiber Driver module are specified to operate over the 0.1-8.0 GHz range. In current receiver plans, all front-ends produce first IF signals within the 1.0-8.0 GHz range. The extra bandwidth below 1 GHz is provided in the Optical Fiber Driver modules in case the need arises in the future to transmit IF signals below 1 GHz.
The IF bandwidth received at the total power detector monitor is determined by bandpass filter(s) in the front-end. No additional filtering is provided in the IF Router or Optical Driver modules.
The up/down conversion process was selected to provide high image rejection and flexible tuning. For a given backend, the user may select any portion of the receiver IF1 band by proper selection of the LO2 frequency. The converter module output signal IF3 is given by:
IF3 = LO3 - LO2 + IF1
where LO3 = 10.50 GHz.
This equation would normally be solved for the value of LO2 needed to convert a particular IF1 frequency to an IF3 frequency needed for a backend. For example, if an IF1 frequency of 3.0 GHz is to be tuned to the 0.75 GHz input center frequency (IF3) of the VLBA Data Acquisition System, LO2 should be set to 12.75 GHz.
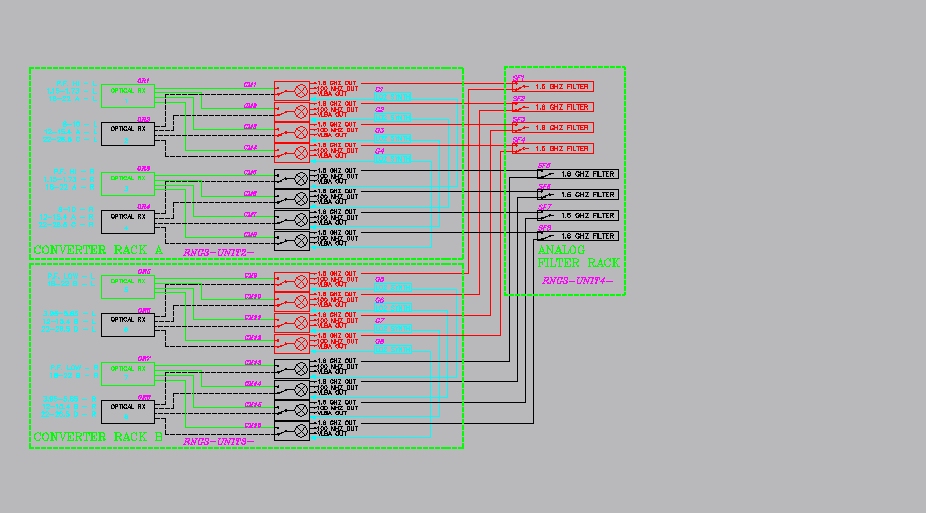
As shown in the IF Distribution block diagram (C35260K009), the interconnections between the optical receivers and the converter modules allow up to four independent converters on each polarization of single-feed or dual-feed receivers. (In this diagram the group of labels to the left of each optical receiver indicate which front-end IF1 will appear at each optical receivers' input. This illustration is based on a somewhat arbitrary plan for connections between the front-ends and the receiver room IF Router. A member of the group shown next to each optical receiver is selected by the IF Router setting. The label - L and - R suffixes indicate orthogonal polarizations from a given feed, and the A, B, C, and D differentiate feeds on multi-feed receivers.) For example, CM1-CM4 and CM5-CM8 could simultaneously receive orthogonal polarizations from the 18-22 GHz "A" feed, and four independent portions of the receiver passband could be selected by the LO2 synthesizers G1-G4. Up to two converters may be connected to each IF channel of an eight channel receiver. Because of the high cost of the LO2 synthesizers, only eight are provided initially, connected to pairs of converter modules which will typically receive orthogonal polarizations from a selected feed. As the need arises, and budgets allow, additional LO2 synthesizers may be added.
In order to use a receiver, the LO1 frequency must be set so as to produce an IF1 signal in the proper range. Constraints on IF1 and LO1 settings for each receiver front-end are given in Table 5-1. For most observations, the default value of LO1 should be calculated by tuning the desired sky center frequency to the recommended IF1 center frequency.
Conversion Formula:
IF1 = - Fsky + LO1
Gregorian Receivers
(Frequencies in GHz)
RF Filter Select:
FL1 - 1.1 to 1.8 GHz
FL2 - 1.60 to 1.75 GHz
FL3 - 1.30 to 1.45 GHz
FL4 - 1.10 to 1.45 GHz
FL5 - For future use
IF Range:
2.6 <=IF1 <=3.4
Recommended IF1 Center Frequency
- 3.00 GHz
LO1 Range:
4.0 <=LO1 <=5.0
Conversion Formula:
IF1 = - Fsky + LO1
RF Filter Select:
FL1 - 3.95 to 4.65 GHz
FL2 - 4.55 to 5.25 GHz
FL3 - 5.15 to 5.85 GHz
FL4 - 3.9 to 5.9 GHz
FL5 - For future use
IF Range:
1 <=IF1 <= 3
Recommended IF1 Center Frequency
- 2.00 GHz
LO1 Range:
5.95 <= LO1 <= 7.85
Conversion Formula:
IF1 = - Fsky + LO1
IF Filter Select:
1.80 <= IF1 <= 4.20
2.75 <= IF1 <= 3.25
Recommended IF1 Center Frequency
- 3.00 GHz
LO1 Range:
10.90 <= LO1 <= 13.10
Conversion Formula:
IF1 = - Fsky + LO1
IF Filter Select:
1.25 <= IF1 <= 4.75
2.75 <= IF1 <= 3.25
Recommended IF1 Center Frequency
- 3.00 GHz
LO1 Range:
8.80 <= LO1 <= 12.60
Conversion Formula:
IF1 = Fsky - LO1
IF Range:
2.00 <= IF1 <= 6.00
Recommended IF1 Center Frequency:
2.50 for 18.0 <= Fsky
<= 19.5
3.50 for 19.0 <= Fsky
<= 20.5
4.50 for 20.0 <= Fsky
<= 21.5
5.50 for 21.0 <=Fsky
<= 22.5
LO1 Range:
15.50 <= LO1 <= 17.00
Conversion Formula:
IF1 = Fsky - LO1
IF Range:
3.50 <=IF1 <=8.00
Recommended IF1 Center Frequency:
4.00 for 22.0 <= Fsky
<= 23.5
5.00 for 23.0 <= Fsky
<= 24.5
6.00 for 24.0 <= Fsky
<= 25.5
7.00 for 25.0 <= Fsky
<= 26.5
LO1 Range:
17.80 <=LO1 <= 19.20
Conversion Formula:
F1 = Fsky - LO1
In order to observe with these modules, the system LO1 and LO2 synthesizers associated with the front-end and 1-8 GHz Converter module in use should be set to convert the center of the Fsky band to the center of the bandpass filter to be used. The filter bandpasses are:
800 MHz Bandwidth          800-1600 MHz
200 MHz Bandwidth          800-1000 MHz
Stated another way, the input center frequencies of the 1.6 GHz Sampler/Filter modules are:
800 MHz Bandwidth          1200 MHz
200 MHz Bandwidth          900 MHz
In order to observe with these modules, the system LO1 and LO2 synthesizers associated with the front-end and 1-8 GHz Converter module in use should be set to convert the center of the Fsky band to (500 MHz - the center frequency of the bandpass filter to be used). The filter bandpasses and center frequencies are:
500 MHz Bandwidth          50-100 MHz             75 MHz
12.5 MHz Bandwidth         25.0-37.5 MHz          31.25 MHz
Stated another way, the input center frequencies of the 100 MHz Converter/Filter modules are:
50 MHz Bandwidth           425 MHz
12.5 MHz Bandwidth         468.75 MHz
1. Activate the 12-15.4 GHz front-end. Rotate the turret and deploy
the subreflector if necessary. Select
the front-end 2.75-3.25 GHz IF filter.
2. Set LO1A to the frequency which converts the 15.0 GHz sky frequency
to 3.0 GHz; LO1 = 15.0-3.0 = 12.0 GHz. Use the LO Router to connect the
LO1A output to the front-end, and set the LO level.
3. Use the IF Router to connect the front-end A-L and A-R IF signals
to Optical Fiber Driver modules; Router input ports 10 and 26 connected
to Drivers 2 and 4.
4. Use Converter modules 2CM1 and 2CM5; connect their inputs to Optical Receiver modules 2 and 4 respectively, using the converter modules SW1 control. Set 2G1 to the frequency which converts the 3.0 GHz IF1 center frequency to 900 MHz, the center of the 200 MHz bandwidth filter:
LO2 = 10.50 - IF3 + IF1
LO2 = 10.50 - 0.9 + 3.0 = 12.60 GHz
5. Connect the Sampler Filter modules 4SF1 and 4SF5 to 2CM1 and 2CM5. Select the 800-1000 MHz filters, and activate the proper spectrometer modes.